By: Russ Kamp, CEO, Ryan ALM, Inc.
Ryan ALM, Inc. prides itself on providing pension sustainability solutions. Working with DB pension plans of all funding levels is what motivates and drives us. As a result, we pay close attention to the current funded status of Pension America. We greatly appreciate the work that Milliman does in providing monthly updates on the health of both private and public pensions.
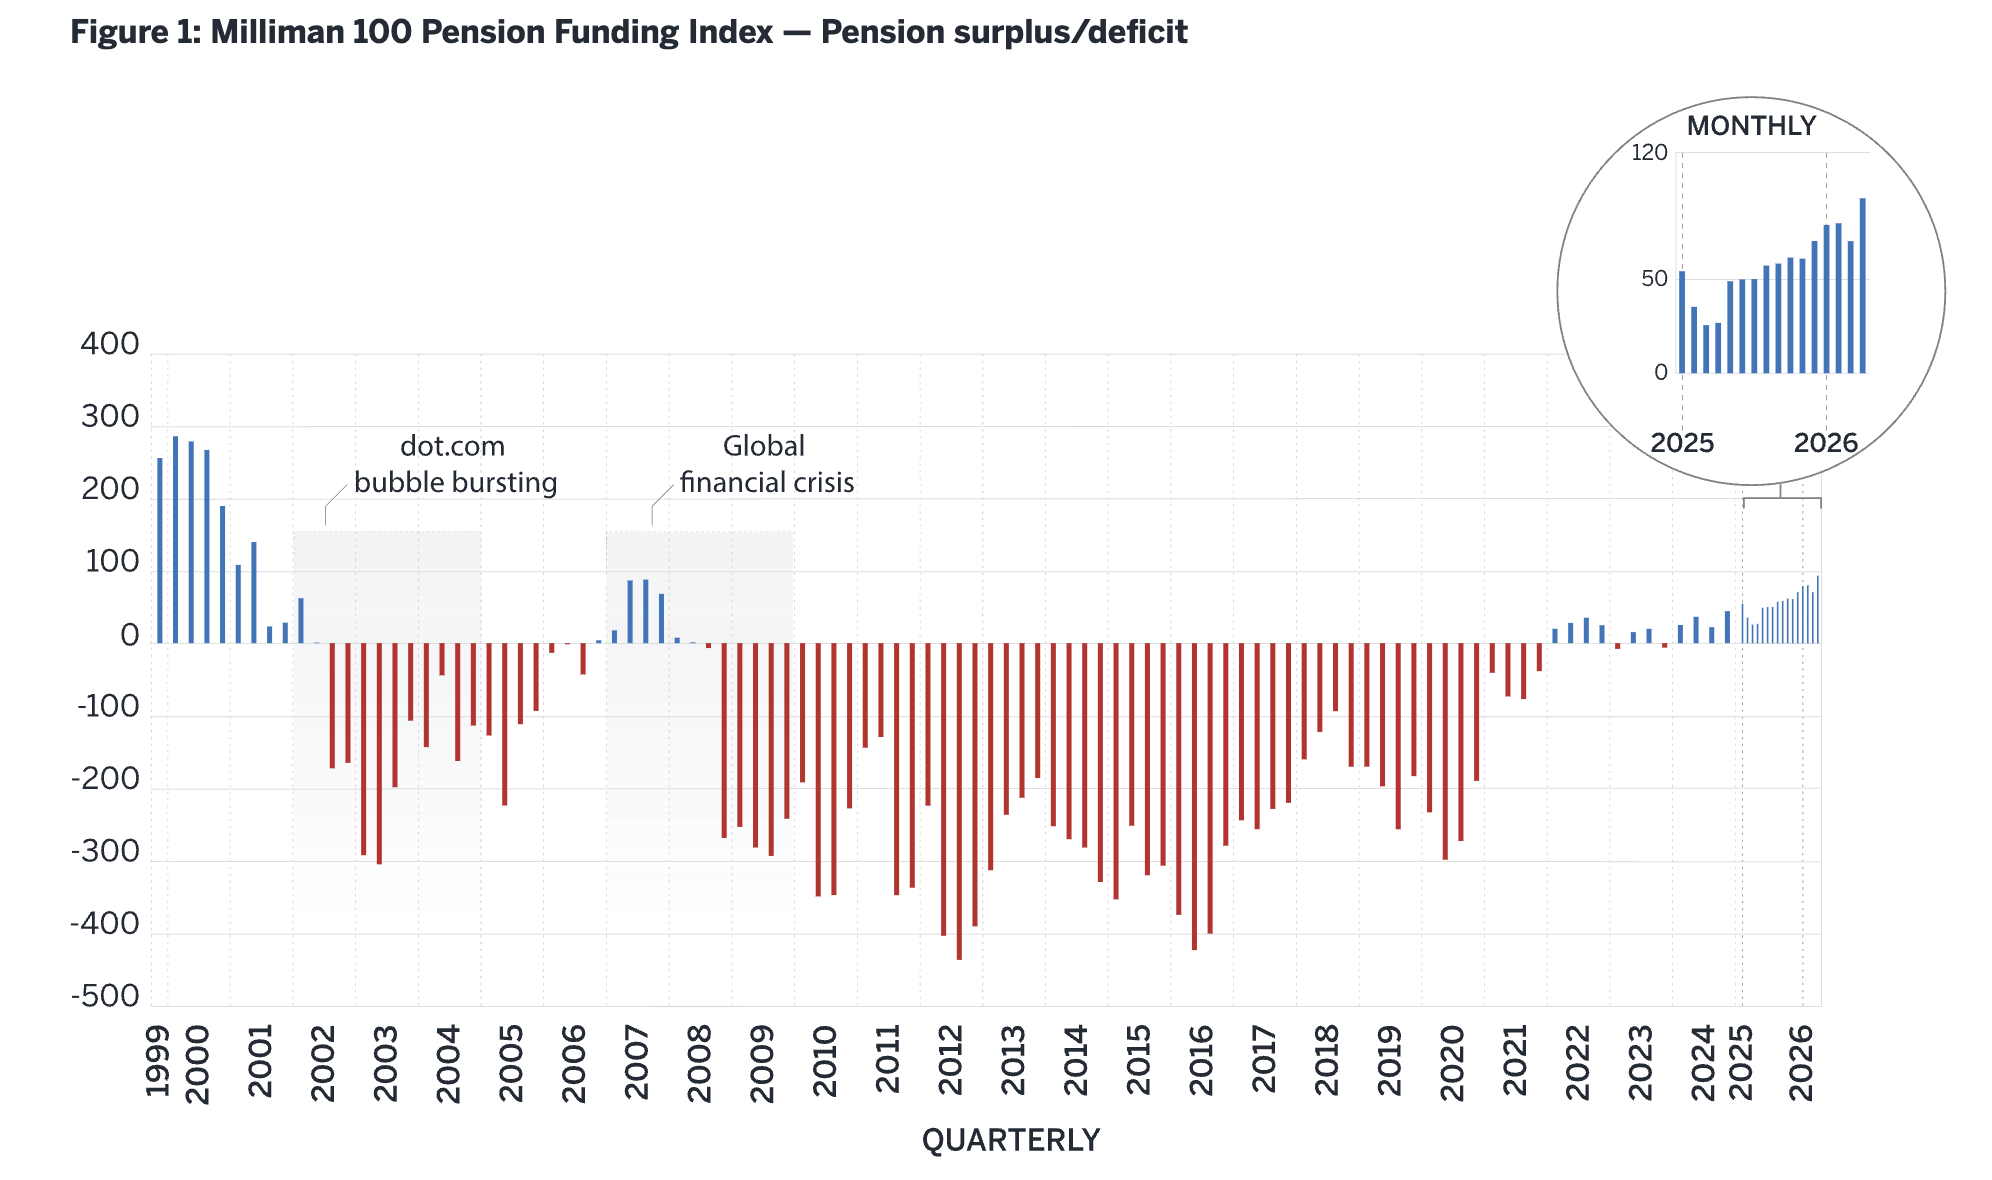
We are pleased to share the output from the Milliman 100 Pension Funding Index (PFI), which, as a reminder, analyzes the 100 largest U.S. corporate pension plans. Given the strong rally in U.S. equities, it is not surprising to see that the collective funded status of the Milliman 100 PFI plans improved by $18 billion during May. As a result, the funded ratio rose from 108.2% as of April 30, to 109.6% as of May 31st. This represents the high water mark in pension funding since July 2001, when it stood at 109.9%.
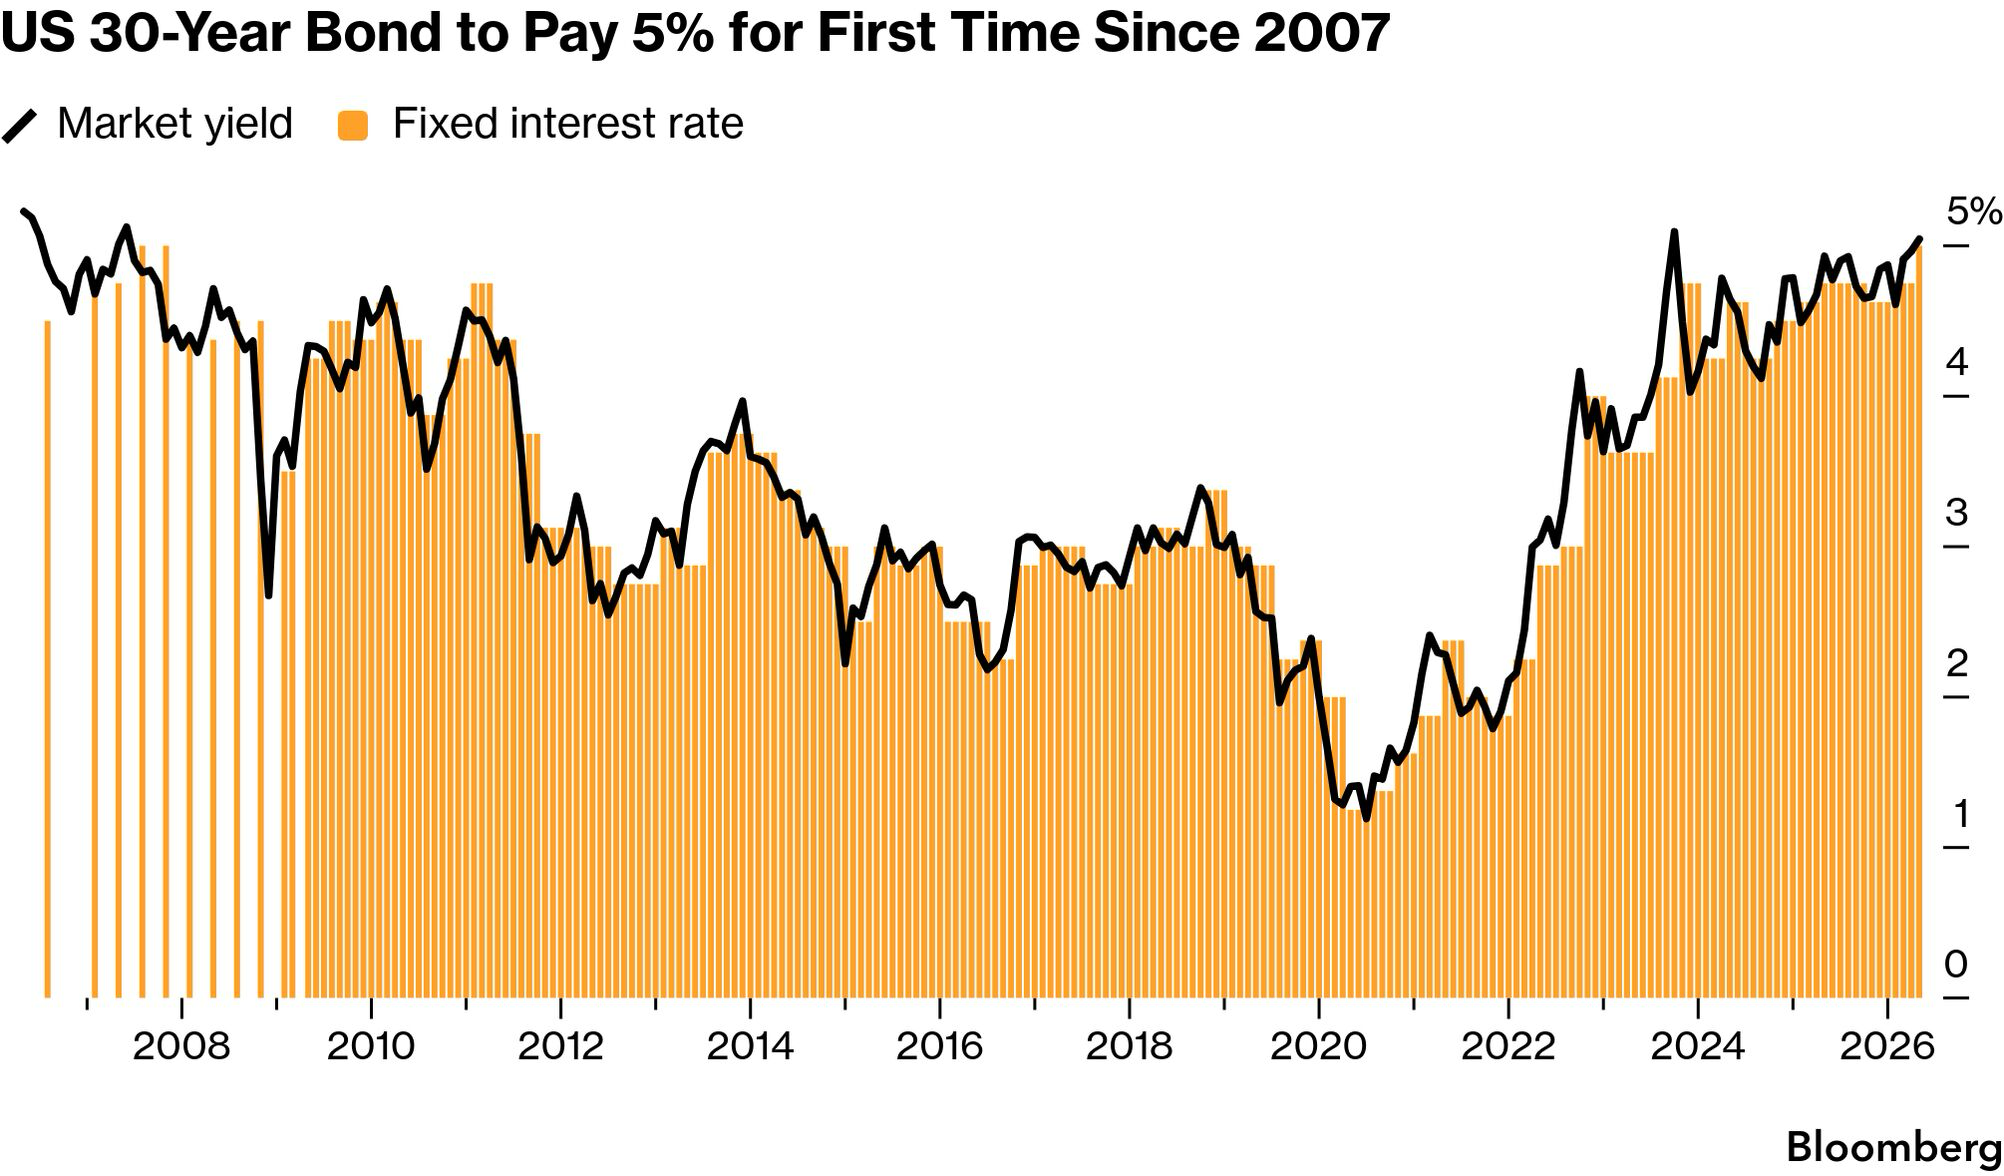
Milliman also reported that plan liabilities also rose during the month, to $1.208 trillion, as the discount rate used to value those future promises fell 4 bps, to 5.62%. Fortunately, the growth in pension liabilities was not enough to offset investment gains of 2.22% for the cohort. The combined assets grew $22 billion during the month to $1.324 trillion, while the funded status surplus reached $116 billion.
“May’s robust returns pushed corporate pensions further into surplus territory, to a level not seen in nearly 25 years,” said Zorast Wadia, Milliman PFI author. “Plan sponsors that haven’t yet pursued de-risking opportunities may want to review their options, as conditions remain highly favorable.” We couldn’t agree more with Zorast. Rising interest rates reduce the present value of those future promises. Defeasing pension liabilities at these rates will lock in the relationship of assets to liabilities.
Markets will do what markets do. Interest rates will rise and fall. Economic uncertainty will come and go. The question is whether your pension plan is structured to withstand those events without jeopardizing the promises made to participants. Don’t subject your pension plan to unnecessary market risk. You’ve worked too hard to get funding to this level.