Are you a recent subscriber (thank you) to the Ryan ALM, Inc. blog? Here’s a little history. I began writing this blog in 2013. I’ll never forget my elementary school friend, Tony, who helped me set up the blog, saying that I shouldn’t start one if I wasn’t going to be consistent in producing content. Well, 13-years later and there are now 1,800+ mostly pension-related posts and more than 600k words. When I joined Ryan ALM, Inc. in the summer of 2019, I was extremely grateful to Ron Ryan for supporting this effort and that support continues to this day, while also being a contributor of important content.
As a new subscriber, what should you expect to read among the plethora of posts? I believe the dominant themes are:
DB Pensions exist to secure promised benefits, not maximize returns.
Pension Liabilities should drive investment decisions and not the ROA.
Funded status matters much more than asset returns.
Cash Flow Matching (CFM) is the most prudent way to secure benefits.
Custom Liability Indexes (CLI) are essential for measuring pension success – good governance.
Reducing uncertainty through fully funding benefits is the true definition of pension risk management.
Defined benefit plans should be protected and preserved.
As a reminder, Ryan ALM, Inc. is an independent pension risk management and SEC registered investment firm that helps defined benefit plans improve funded status, reduce liability risk, enhance liquidity, and secure retirement promises through custom liability measurement, cash flow matching, actuarially informed investment strategies, and ongoing monitoring.
Don’t hesitate to reach out to us with your questions and/or comments. They are always welcome on this blog, which can be found here.
The only reason that your DB pension plan exists is because a promise was given to your participants that they would receive a monthly benefit for life upon meeting some requirements such as years employed and retirement age. The promise wasn’t based on whether your particular pension fund achieved the annual return on asset assumption (ROA). If the ROA was achieved – great. Contributions would be as forecasted by your actuary. If not, it would be time to ante up more in annual contributions. But at the end of the day, you remain on the hook to make that monthly payment.
Given that reality, does it make sense that the primary focus is on the ROA and not the promised benefits? Regrettably, for most of Pension America, the annual ROA is the goal. However, pursuing that objective only guarantees volatility and not success. On the other hand, we, at Ryan ALM, Inc., believe that the primary pension objective is to SECURE the promised benefits at a reasonable cost and with prudent risk. By securing that promise, you eliminate uncertainty and volatility in the funded status.
Here’s the rub, the pension liabilities are the domain of the actuaries, while asset allocation falls to the asset consultants. How often do those entities communicate? How often do you as the plan sponsor know how that promise you made is behaving? Does it make sense to you that assets are constantly being measured while the liabilities may get a once per year update 4-6 months delayed? Wouldn’t it make much more sense to have both the assets and liabilities updated at the same time so that asset allocation adjustments could be made as necessary?
Think about a bridge with two primary supports. One of the supports are representative of the actuaries and the other one is the asset consultants. To get from one side of the pension canyon to the other side, there needs to be a connector. What entity is that? It is not your investment managers, who are focused on a generic benchmark and not your plan’s liabilities. Ryan ALM believes that we can be that entity, as we provide a turnkey system of sustainable solutions to make sure that each pension fund that we support understands the promises that have been made, develops the correct cash flow roadmap, and carefully constructs the necessary match between liability cash flows of benefits and expenses with the asset cash flows (principal and interest) from IG bonds to SECURE those monthly promises.
Our mission is to secure your promises at both low cost and with prudent risk. It is not to have you sit firmly on the rollercoaster of market returns with the hope that the plan’s asset allocation will deliver a return near the ROA. The current breakdown in communication between actuaries and asset consultants is like trying to clap with one hand. As hard as you try, it just won’t work. Let Ryan ALM be your bridge. With us you’ll receive a monthly Custom Liability Index (CLI) based on your fund’s forecasted liabilities, monthly liquidity chronologically as far into the future as your allocation to a cash flow matching (CFM) mandate covers, time for the residual assets (alpha assets) to grow, low cost management fees, ongoing monitoring of the relationship of assets to liabilities, and a stable funded ratio and contribution expenses for that portion of the plan. We connect assets to liabilities through our proprietary turnkey system of four products. Think of us as the maestro leading the orchestra. Both hands are working for you and your participants.
Ryan ALM helps defined benefit pension plans understand and manage the COMPLETE economics of their pension promise. Using cash flow projections of contributions, benefits, and expenses, the Ryan organization uses its proprietary liability valuation methodologies (ASC 715 discount rates), its trademarked Custom Liability Index (CLI), and our cash flow matching strategy that we call the Liability Beta Portfolio (LBP) to develop investment SOLUTIONS designed to align plan asset cash flows with liability cash flows. It is the SECURING of those future obligations that should be the paramount activity when managing a pension plan.
We refer to this process as a turnkey system, which Ron Ryan, Ryan ALM’s Chairman, recently described in great detail. We believe that our firm is unique in this regard. Unfortunately, pension plans today receive an actuarial update at most once per year, perhaps 4-6 months delayed. They rely on their asset consultants to create an asset allocation that should reflect the funded status but often the allocations are driven by the ROA. Investment managers are then retained to manage strategies based on the asset allocation, but not the plan’s liabilities. That seems pretty disjointed to us.
Ryan ALM’s competitive advantage is its proprietary turnkey system that integrates:
Liability valuation through discount-rate modeling
Cash-flow forecasting
Liability benchmark construction
Portfolio implementation
Ongoing monitoring
A true repeatable framework focused on the long-term SUSTAINABILITY of pension plans. Most pension plans don’t have such a system. They receive quarterly investment reports and annual actuarial valuations, but nobody integrates the assets and liabilities into a synergistic decision-making framework. Have you ever wondered: “How has the plan’s financial health changed since our last meeting, and what risks should we be paying attention to?” If not, you should be. Do you know where your liquidity is going to come from to meet those ongoing monthly obligations?
Ryan ALM would be happy to provide you with a free cash flow analysis based on our proprietary turnkey system. Given significant uncertainty today, a short 30-minute conversation followed by our analysis could ensure that your fund is set up for long-term success.
U.S. fixed income benefitted tremendously from the nearly 4-decade decline in interest rates. From 1981 through 2021, the U.S. enjoyed a significant collapse in bond yields helping to fuel an unprecedented rally in risk assets. However, as Bob Dylan said, “the times they are a changin”!
The U.S. Federal Reserve’s FOMC announced on March 16, 2022, that the new Fed Fund’s target would be 0.25%-0.5% beginning on St. Patrick’s day 2022. This action marked the beginning of a rate regime change resulting from Covid-19 implications, including abundant stimulus creating massive demand for goods and services that couldn’t be met as production/manufacturing activities were disrupted.
The U.S. Fed Fund’s rate would eventually rise to 5.25%-5.50% in July 2023 (following 11 rate increases). Today, the Fed Fund’s rate stands at 3.5%-3.75%. For context, the average Fed Fund’s rate since 1971 is 5.39%, which includes a peak of nearly 20% in December 1980, and ultimately 0% in December 2008, in reaction to the GFC. It would once again hit 0% during Covid.
As a result, bond investors, such as pension plans, have ridden a rollercoaster of performance. Performance looked terrific for much of the nearly 40-year bull market but has been challenging since the Fed’s initial action in 2022. In fact, the Aggregate Index (Lehman, Barclays, Bloomberg, etc.) has produced only a 3.3% return for 20-years through March 2026. It is worse if you look at shorter timeframes, as the Index was up only 1.7% for 10-years, 0.3% for 5-years, and -0.1% YTD (all through March 31, 2026).
For pension plan sponsors and their advisors who are reluctant to utilize cash flow matching (CFM) as it might harm the pension plan’s ability to achieve the ROA, those performance #s above should be a wake-up call! As a reminder, the YTM of a CFM portfolio is a good proxy for what the fund will achieve for the period that liabilities are defeased. Given that Ryan ALM, Inc. is currently generating a YTM of 5.02% for a client with a 30-year defeasement and a 4.6% YTM for another with a 10-year CFM mandate, which result do you think is more harmful to the pension plan?
Furthermore, the CFM portfolio’s return is not predicated on the direction of interest rates, as it very much is with active core fixed income strategies. Importantly, CFM provides all the liquidity needed to meet the monthly benefit payments without having to sell assets, perhaps at inappropriate times. By cash flow matching bond principal and interest income with the plan’s liability cash flows (benefits and expenses), CFM secures the pension promises and reduces the FV cost (with certainty) of those obligations in the process. For the client with the 30-year CFM mandate, we are reducing future funding costs by -31.1% and for the 10-year CFM program, we have reduced funding cost by -28.0%.
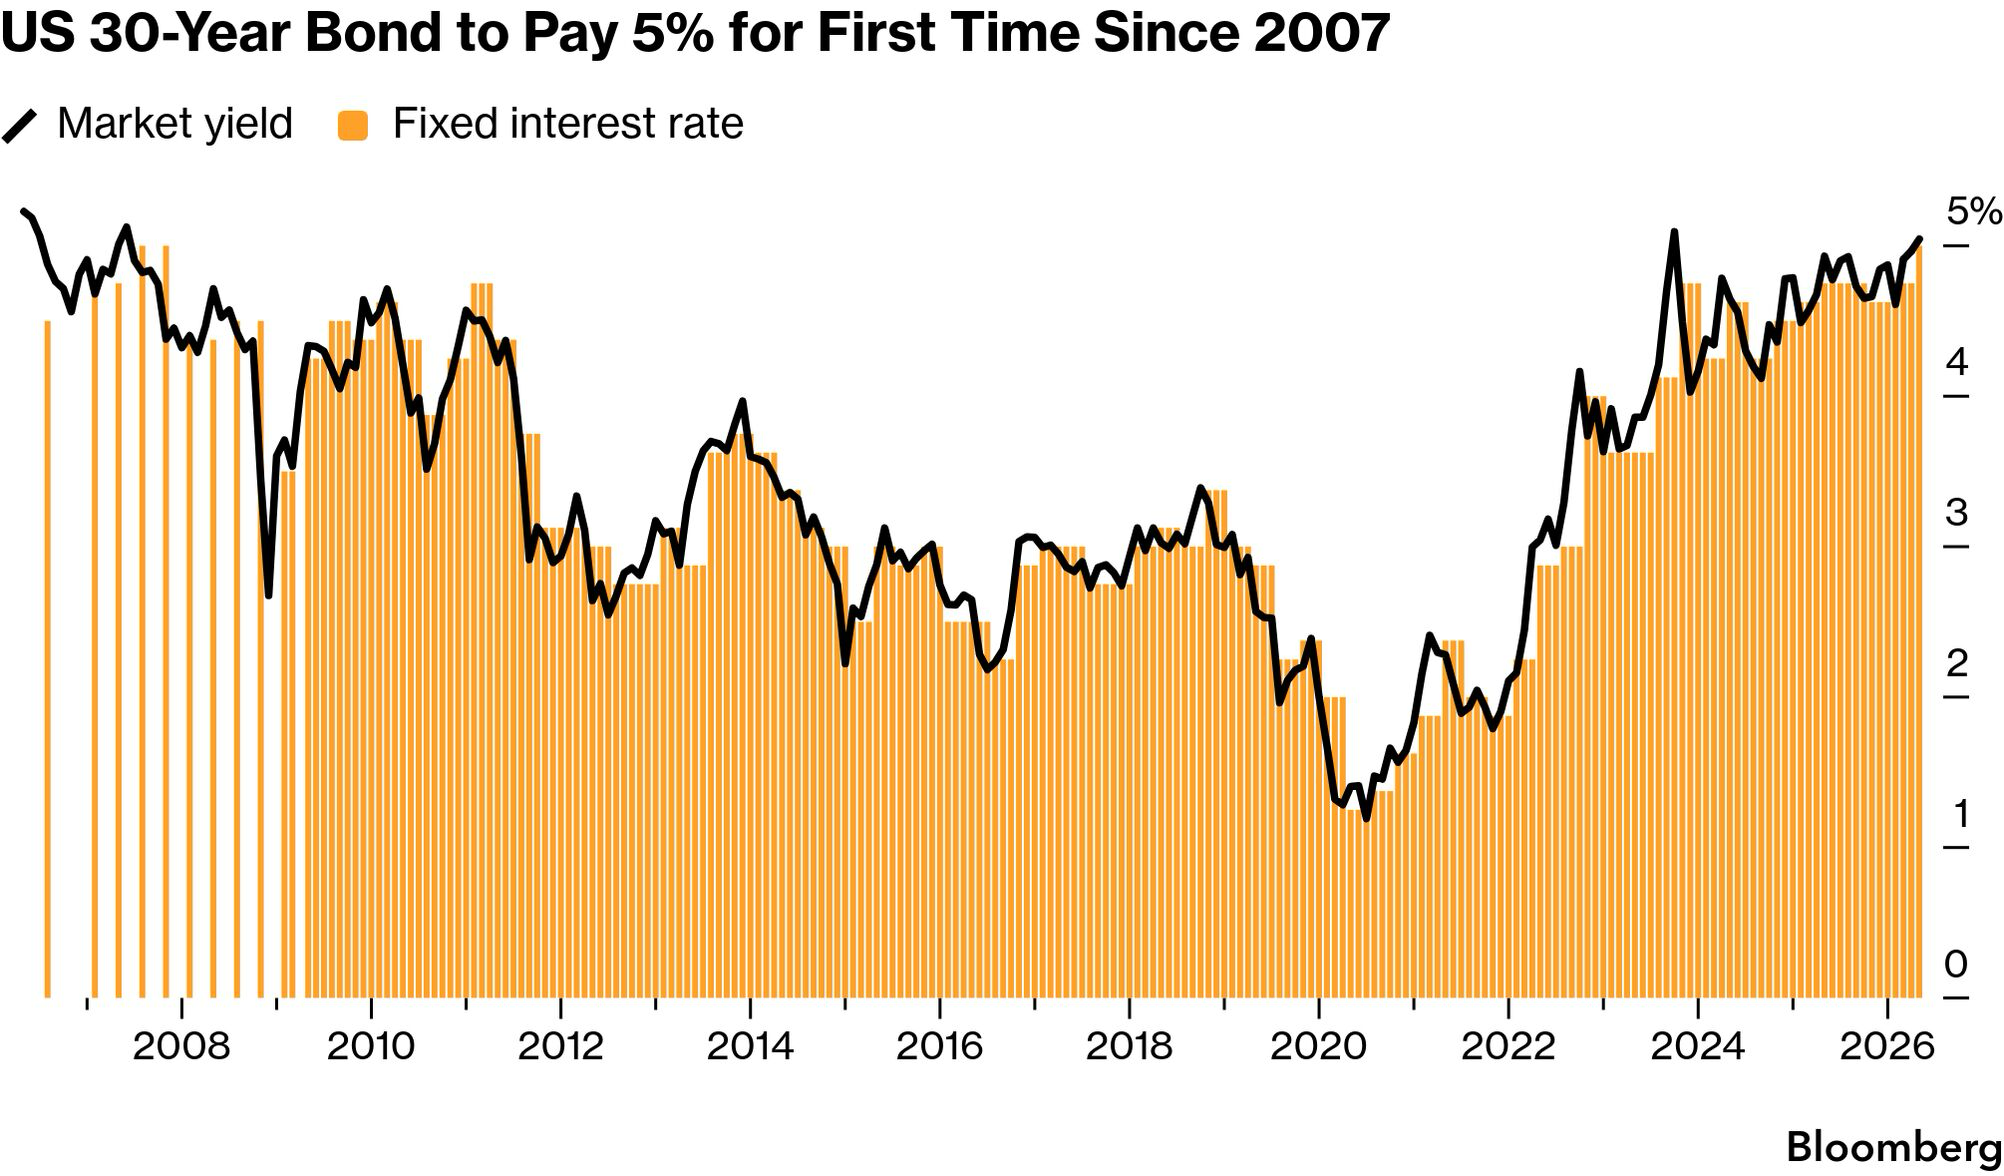
Where are we today? After a brief respite, U.S interest rates are once again trending higher, as greater inflation takes hold. Who knows where inflation and interest rates will eventually land, but a pension plan (or E&F) could benefit tremendously in this environment by engaging Ryan ALM, Inc. and our CFM capability. The 30-year Treasury bond yield history below highlights the rising rate environment. As a reminder, Ryan ALM builds CFM portfolios using investment-grade corporate that have yields substantially higher than comparable Treasury maturities.
So, I ask: Why sit with active fixed income and subject your plan’s bond allocation to the whims of an unknown interest rate environment when you can SECURE the pension promise with near certainty (absent any defaults)? Wouldn’t it be wonderful to know that your liquidity needs are all set for some prescribed period? Wouldn’t your plan participants want to know that the promises given have been secured? Now is the time to bring an element of certainty to the management of pension assets that doesn’t currently exist. Given the geopolitical uncertainty and the potential impact on inflation, rates, and other markets, creating funding certainty should be priority #1. Why isn’t it?
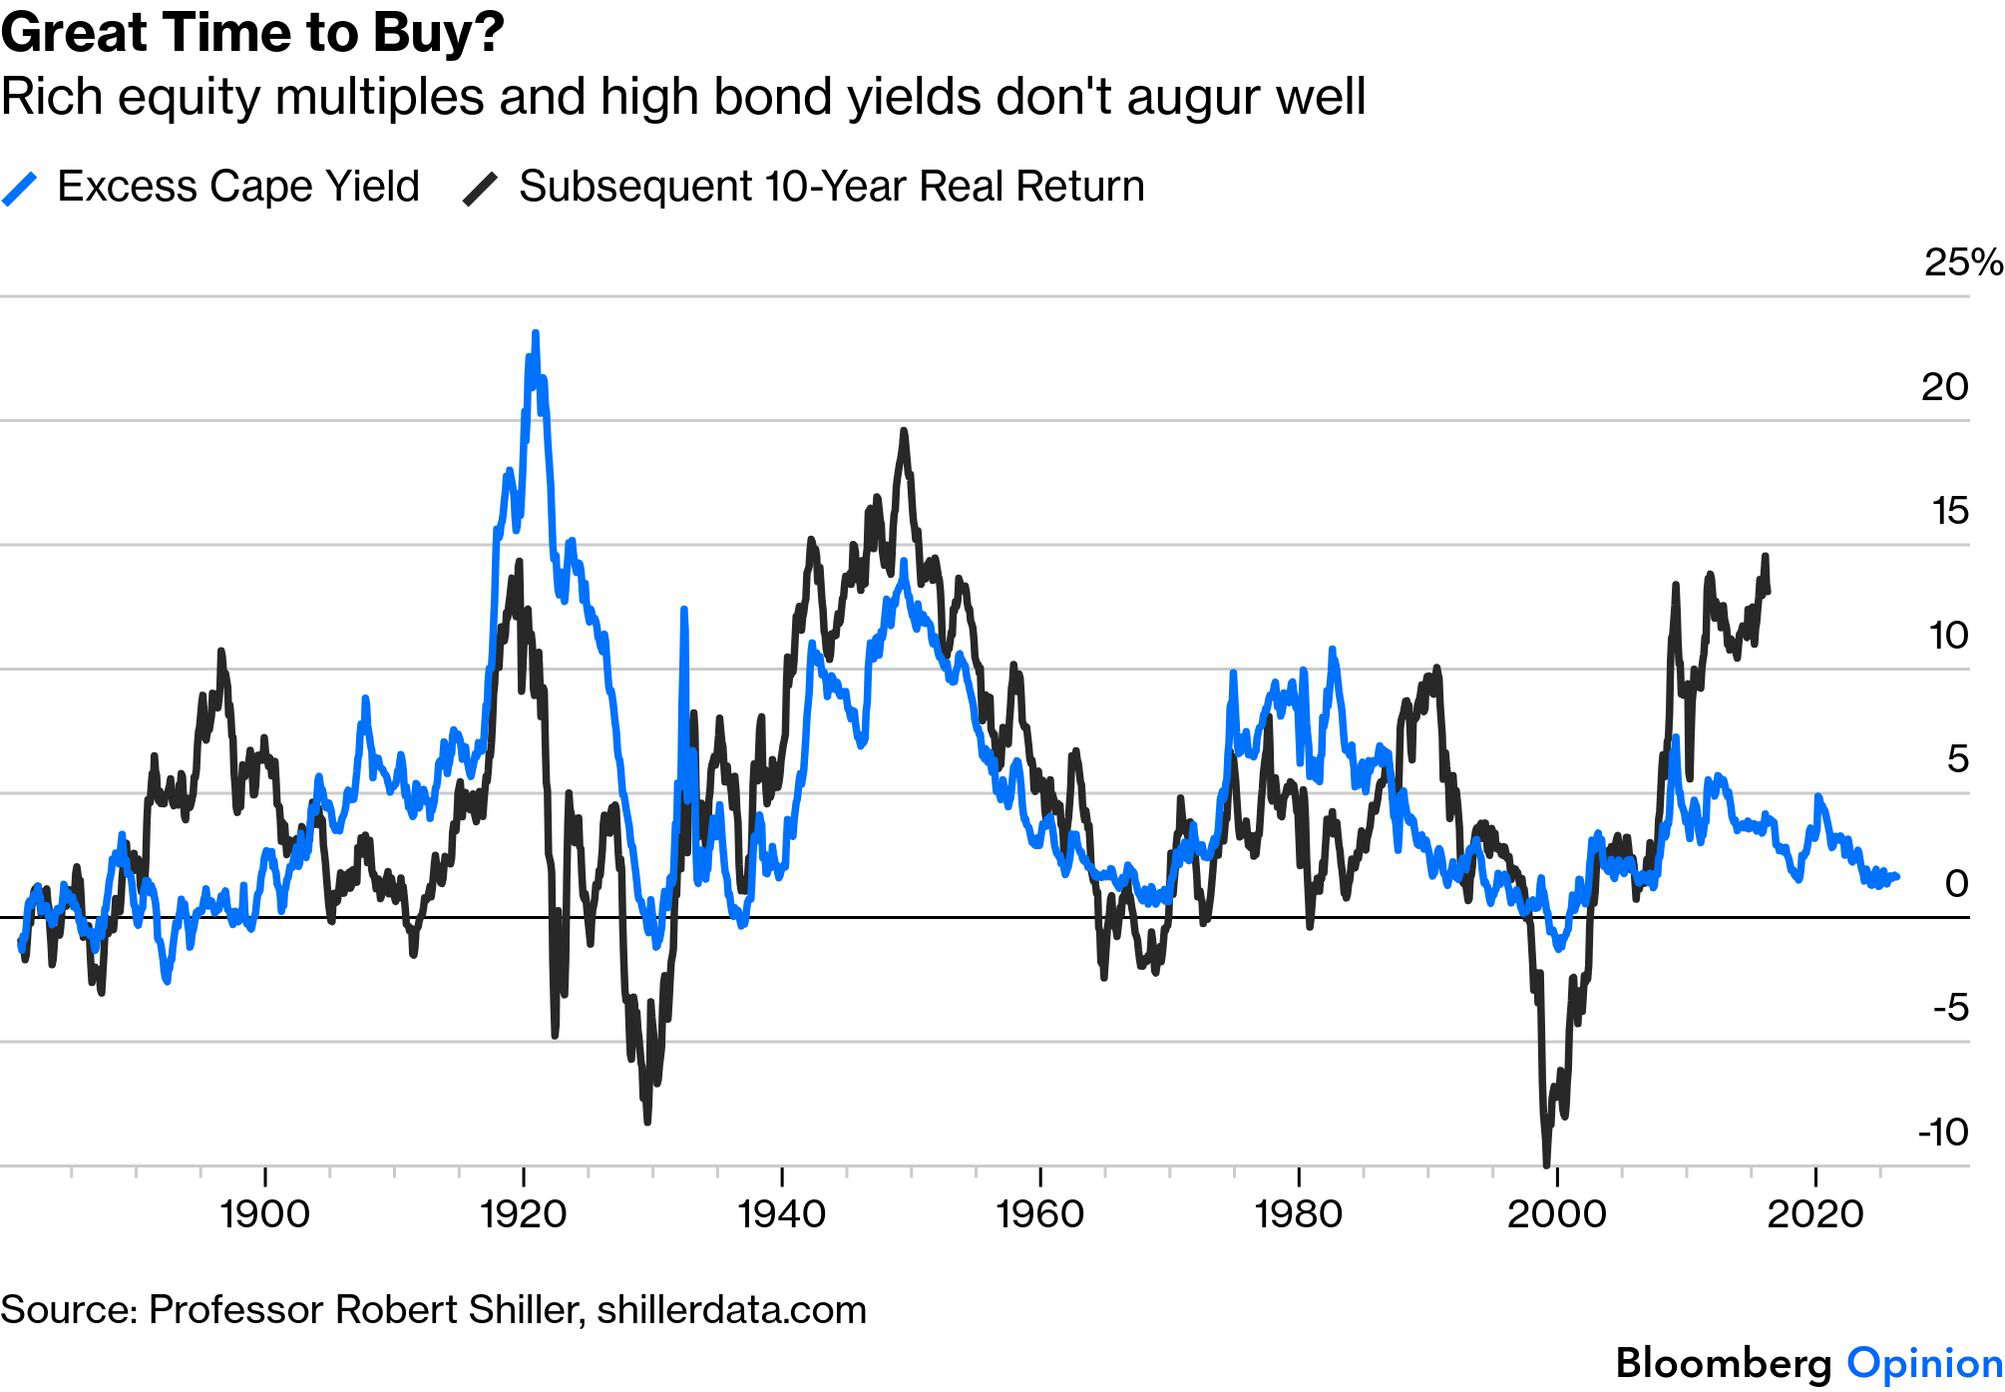
U.S. equity markets enjoyed a robust April despite myriad economic and geopolitical inputs that might have given investors pause. Should equity investors remain bullish at this time? The graph below caught my attention primarily because of the recent disconnect between the two lines related to the Shiller Excess Cape Yield (ECY) and subsequent 10-year Real Return for equities. There are many, many valuation tools that claim to provide clues about the future direction of stocks, and this is such an example. Those tools can be short-, medium-, and long-term in nature. The ECY happens to be one valuation metric that provides “guidance” for longer time frames. The current reading of 1.60% certainly looks rich relative to its long history.
In case you don’t know, the Shiller excess CAPE yield is a valuation measure that compares the stock market’s earnings yield with the “real” yield on the 10-year Treasury note. In simple terms, it asks how much extra return stocks may offer over inflation-adjusted government bonds.
How it is calculated
Take the inverse of the CAPE ratio, which is the market’s “earnings yield.”
Subtract the real 10-year Treasury yield.
So,
A higher excess CAPE yield suggests stocks might look more attractive relative to bonds. A lower reading suggests the equity risk premium is thinner, meaning stocks offer less return versus bonds. As mentioned above, current readings show the S&P 500 Shiller Excess CAPE Yield around 1.60% for April 2026, which is well below its long-term average of 4.60%. Another data source put it at 1.41 as of April 30, 2026.
Investors have historically used the ECY as a long-term asset allocation tool, especially when comparing stocks with Treasury bonds. It is not a short-term trading signal, but rather a rough guide to whether equities look cheap or expensive relative to real bond yields. A CAPE yield below 2% has generally signaled subdued future equity returns over the next 5 to 10 years, providing a valuation warning sign, and not an exact measure.
As a reminder, there are many valuation techniques used to identify opportunities and risk when investing in U.S. equities. Depending on a pension plan’s liquidity needs, funded ratio, willingness to take risk, etc. today’s current environment may be providing an opportunity to reduce risk by trimming equities and using the proceeds along with core fixed income assets to establish a cash flow matching mandate. In the process, the plan’s liquidity is improved, promised benefits secured, and the investing horizon extended for the residual assets. Give us a call. We are always willing to provide a free analysis showcasing how CFM can help your fund.
The funded ratio of a DB pension plan gets a lot of attention, especially if it is perceived to be weak. But does the funded ratio truly tell you the whole story as to the financial health of a DB pension plan? We, at Ryan ALM, Inc. don’t think so.
So, how is the funded ratio calculated:
Funded ratio = MV of plan assets / plan liabilities earned to date X 100
The market value of assets is a present value (PV) calculation. The market value of liabilities is the future value of liabilities earned to date discounted back to a PV calculation based on a discount rate. For public and multiemployer plans the discount rate tends to be the fund’s return on asset assumption (ROA), while it is an AA corporate blended rate for private pensions. In today’s interest rate environment, the discount rate for private plans will be roughly 1.5% less than the discount rate based on the average ROA. That means that liabilities for private funds will have a greater current value than the value of liabilities calculated based on the discount rate using the ROA. Oh, okay, so the choice of a discount rate can change my funded ratio. That’s interesting. So that tells me that if I wanted to improve my funded ratio, all I’d have to do is increase my discount rate to lower the PV of my liabilities. That’s very interesting.
So, it appears that the funded ratio calculation can be manipulated to some extent. As we think about the formula above, is there anything missing? Yes, where are the future contributions, which can be significant. Why are future payment liabilities in the calculation, but projected contributions, which are future assets of the fund, not included? Common thinking suggests that those future contributions aren’t guaranteed, which is why they aren’t factored into the funded ratio calculation. However, is that a correct assumption? In doing some research, it appears >80% of DB pension funds receive 100% of the annual required contribution (ARC). Even NJ’s public pension system is making the ARC and then some.
We recently had a conversation with a large plan sponsor who thought that their fund was <50% funded based on the formula above. Not surprisingly, they were very focused on this ratio and looking for investment strategies that could potentially enhance it. As an FYI, this plan’s future contributions as forecasted by their actuary were significant. In fact, future contributions were so large that they were equal to 73% of the forecasted liabilities! Yes, without including the pension fund’s current assets, this plan was 73% funded, provided those projected contributions were met which they have been for more than a decade.
So, given these forecasted contributions is that pension fund really <50% funded?
In another example, the same fund that thought that they were poorly funded, could defease net pension liabilities for the next 33-years. How is it possible that a plan that believes it is <50% funded able to significantly reduce risk, enhance liquidity, and SECURE pension promises for 33-years? Furthermore, this fund was going to establish a $4.4 billion surplus on the day that those benefits and expenses were defeased for 33-years. If it just earned the projected ROA, that $4.4 billion would grow to $34.2 billion during that 33-year period. Wow!
So, I ask once more, does that sound like a plan in financial distress, which a funded ratio of <50% might suggest? NO!
The funded ratio is but one measure of a pension plan’s health. Unfortunately, many in our industry would look at that # and say that more risk needs to be taken to achieve “full funding” down the road, when in fact reducing risk through a cash flow matching (CFM) strategy is the appropriate approach. It is past the time to get off the scary asset allocation rollercoaster.
Happy St. Paddy’s Day to my Irish friends (I’m 1/2 Irish) and those that would like to be. May the luck of the Irish embrace you today.
As many of you know, we are always willing to provide to the pension and E&F communities a free analysis to highlight how a Cash Flow Matching (CFM) mandate could secure the promised benefits/grants for your fund and importantly, provide the necessary liquidity to meet future promises. In many cases, we will produce multiple runs covering a variety of periods usually 5-years to 30-years. Often the sponsor of the fund is shocked by the potential cost reduction of those future obligations.
We recently provided a large pension plan with several potential implementations, as they try to improve the fund’s liquidity profile, while also desiring to secure those future promises. Here are three scenarios that we provided to them and I’d welcome your feedback on what you would do.
Scenario #1 – Provide a CFM portfolio using the core fixed income allocation ($3 billion/15% of total assets) to match and fund the NET (after contributions) liability cash flows of benefits and expenses (B&E). In this scenario, we can cover the next 6-years of B&E through 6/30/32, covering $3.44 billion in FV benefits and expenses for $3.0 billion (a cost reduction of $443.3k or 12.88%). The YTM on the portfolio is 4.09 and the duration 3.09 years, with the average quality being A-. The remaining assets can continue to be managed as they currently are, but they now benefit from a 6-year investing horizon in which they are no longer providing any liquidity to meet monthly obligations.
Scenario #2 – Provide a CFM portfolio using the same $3 billion (only needed $2.96 billion) or 15% of the fund’s total assets, but implement the strategy using a vertical slice of the liabilities going out 30-years. In this example, we can cover 22% of the liability cash flows for the next 30-years. The FV of those liabilities are $6.3 billion (as opposed to the $3.44 billion using 100% CFM for 6-years). We can reduce the FV cost by $3.33 billion or 53%. The remaining 85% of the fund’s assets can be managed as they presently are, but they don’t benefit from the longer investing horizon, as they will be called upon to provide liquidity to meet the residual B&E.
Scenario #3 – 100% CFM covering net liabilities through 6/30/59. In this case we showed that we can cover 100% of the NET B&E for $9.9 billion in assets, while providing the plan with a $4.4 billion surplus. The FV of those B&E through 2059 are reduced by about $13 billion or 56%! The surplus assets now have a 33-year investing horizon to just grow and grow! A modest 6.5% annualized return for that period produces a surplus of $34.2 billion that can be used to fund B&E after 2059, enhance benefits, and/or reduce future contributions. An 8% annualized return produces a surplus >$75 billion. Oh, my! Also, in this scenario, the organization ONLY needs an annual 2.56% return on the remaining assets to fully fund ALL projected B&E well beyond 2059, as determined by our Asset Exhaustion Test (AET).
Importantly, these scenarios only work if the sponsoring entity provides the forecasted contributions, which in this case they have consistently done for the past 10+ years.
So, I ask once again, what would you do? Scenario 1 ($3 billion/15% of total assets) provides a 100% coverage for 6-years while reducing cost by 13%. Scenario 2 reduces the cost of FV B&E by 53% or $3.4 billion, but covers only 22% of the liabilities, while Scenario 3 reduces the FV cost by 56%, while securing the net promises through 2059 for a cost of $9.9 billion resulting in a surplus of $4.4 billion.
I guess that there is a fourth scenario which is to do nothing, but why would you want to continue to ride the proverbial performance rollercoaster that only guarantees volatility and not success when you can secure a portion of the liabilities, significantly reduce the cost of those future promises, improve liquidity, and “buy time” for the residual assets to just grow unencumbered?
As the Irish say – “May the most you wish for be the least you get“.
I started raising alarm bells related to DB pension exposure to alternatives – mainly private equity and private credit several years ago, and have produced roughly a dozen blog posts that touch on this issue. You may recall some of the posts from 2024:
Well, unfortunately it appears that it is time to pay the piper! As mentioned in the posts listed above, we as an industry don’t truly appreciate the idea that there is a natural capacity to EVERY investment. As an industry, we DO overwhelm good ideas and those funds that are late to the party are often left with just the crumbs in the chaffing dish.
I stumbled over a good, but scary, list of recent events within private credit. The list was compiled by Ignacio Ramirez Moreno, Host of The Blunt Dollar Podcast:
Cliffwater saw 14% redemption requests.
Morgan Stanley’s fund got 10.9%.
Blackstone hit a record 7.9%.
All three capped withdrawals below what investors requested.
Glendon Capital flagged concerns about Blue Owl’s valuations.
Pimco called it “a crisis of really bad underwriting.”
JPMorgan’s marking down loans and tightening lending to private credit funds.
Partners Group thinks defaults could double.
Pimco’s predicting a “full-blown default cycle.”
Apollo’s saying the pain could last 12-18 months.
Well, that is some list! In addition, I was always quite skeptical of the credit quality that was assigned to these companies, and I guess that I wasn’t too far off given that 43% of private credit borrowers have negative free cash flow. Furthermore, the U.S./Israel vs. Iran war won’t help either, as inflation expectations have ratcheted higher reducing significantly the prospects for Fed action leading to lower rates. In fact, it would not be surprising to see the Fed have to raise rates. If such an action occurs, the higher interest rates could exacerbate the current challenging environment for private debt borrowers and their income statements.
Let’s see how the pension plan sponsor community and their advisors deal with private credit’s first real crisis. It should be both interesting and likely painful.
I’ll be wearing my green tomorrow. How about you? Perhaps the luck of the Irish will carry some weight with the PBGC during the upcoming week, but it didn’t have much sway last week.
The PBGC accepted two revised applications for Special Financial Assistance (SFA) for the week ending March 13th. Iron Workers Local No. 12 Pension Fund and the Iron Workers-Laborers Pension Plan of Cumberland, Maryland submitted revised applications. Together they are seeking a modest $24.2 million for their 1,413 plan participants. The PBGC will have 120-days to act on the applications.
According to the PBGC’s website, their e-Filing Portal remains temporarily closed. As discussed previously, there is one fund currently on the waitlist that hasn’t submitted an initial application that is not classified as a Plan Terminated by Mass Withdrawal before 2020 Plan Year.
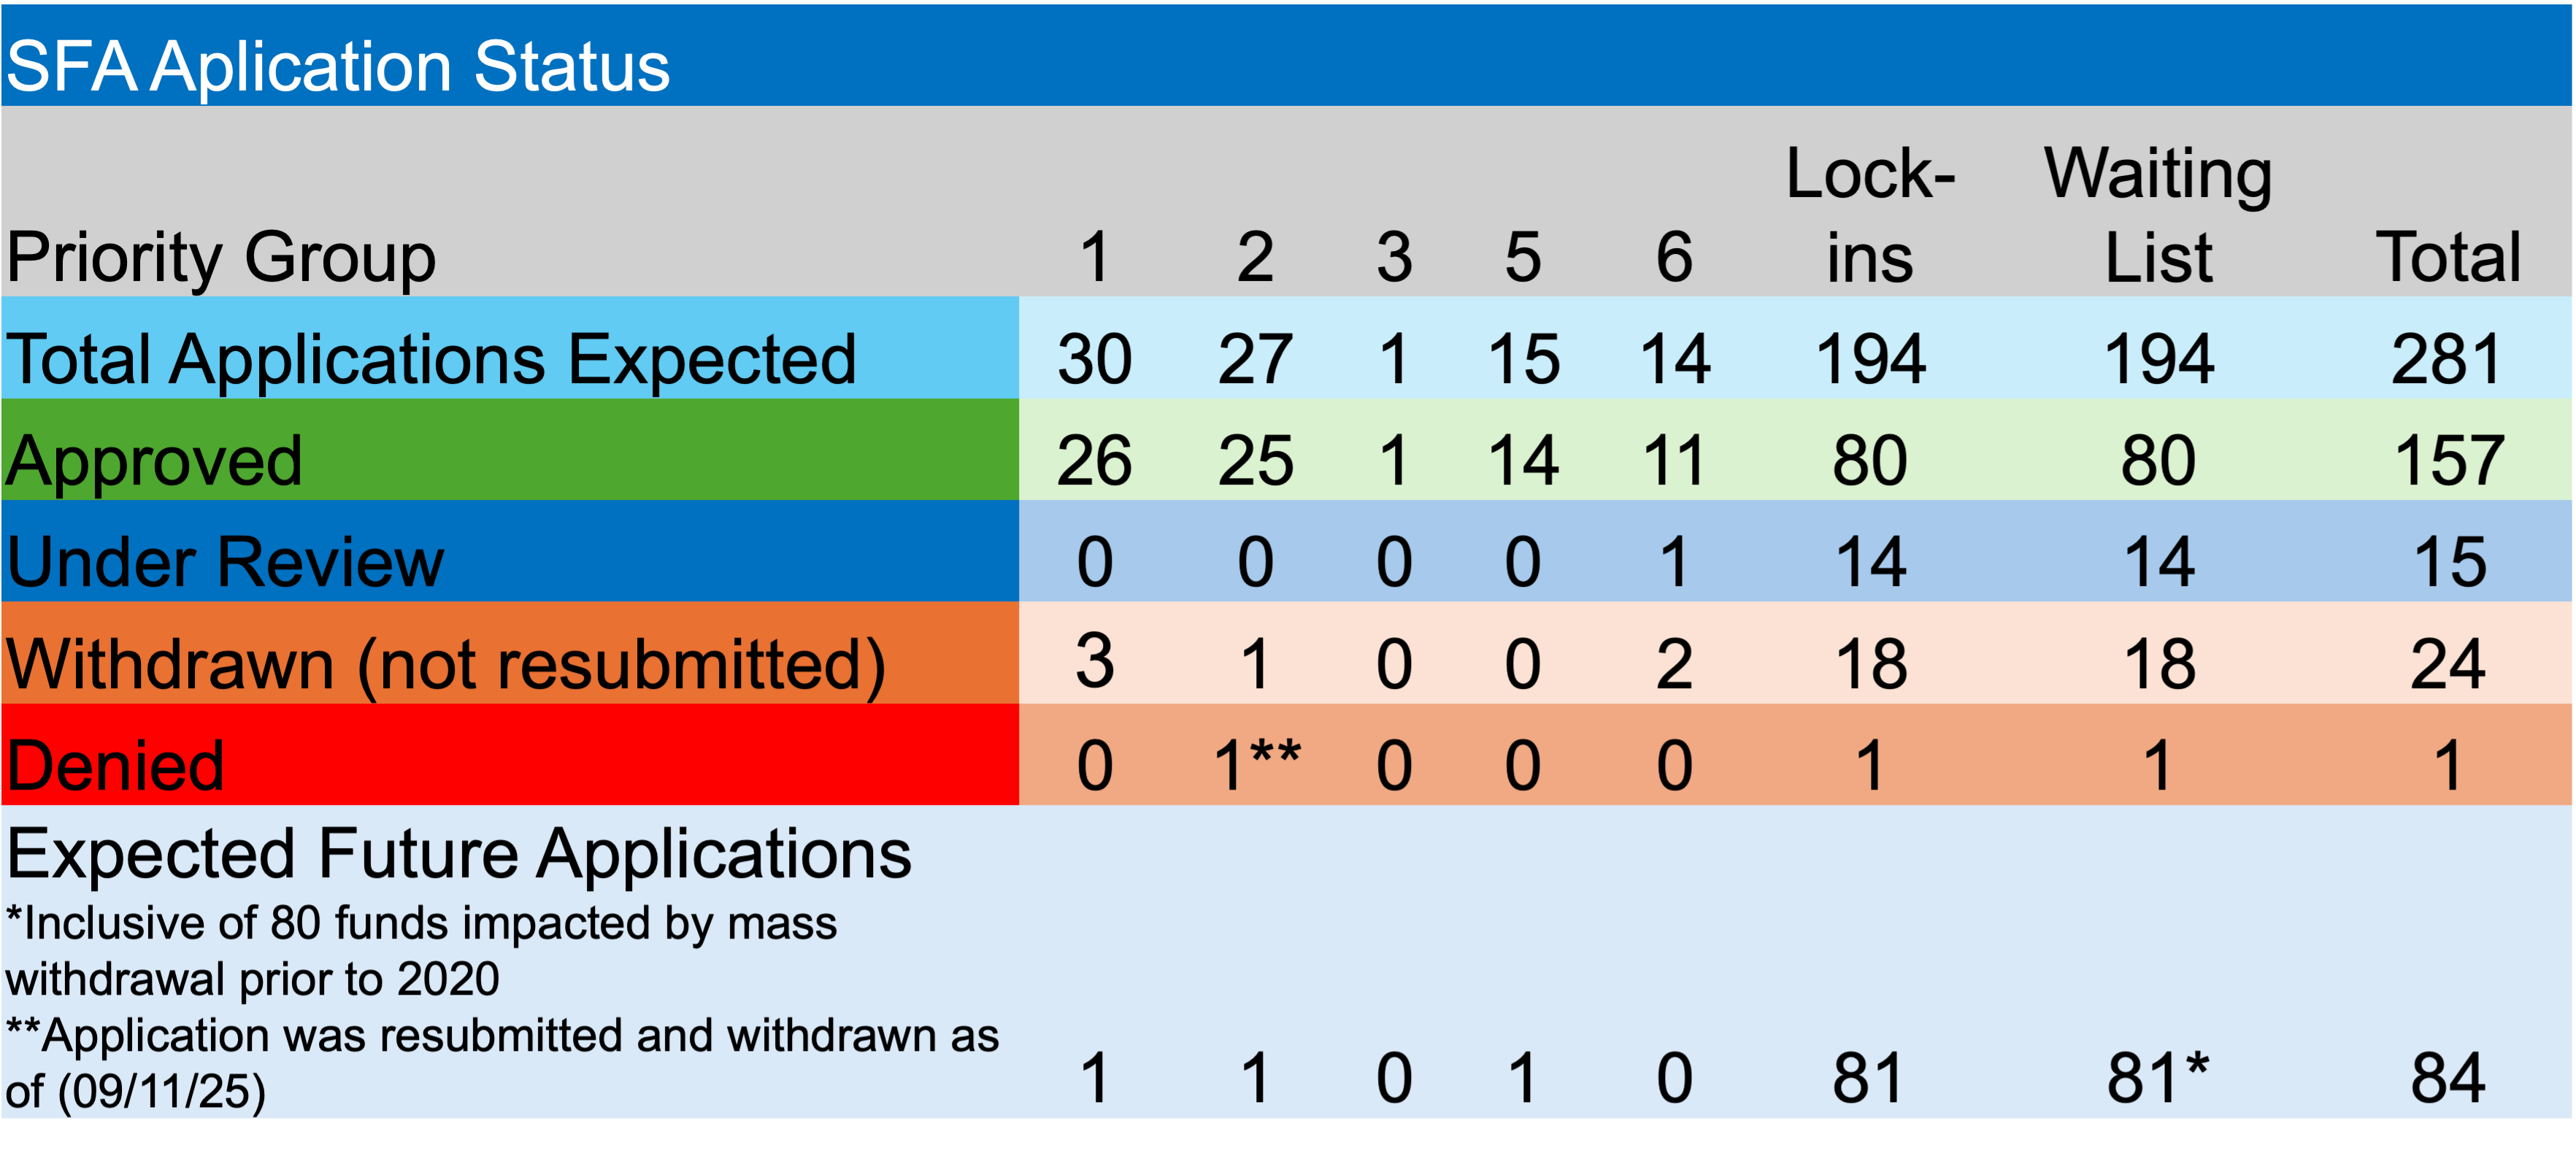
In other ARPA news, there were no applications approved or denied in the past week, and none withdrawn. The PBGC currently has 15 applications under review, including nine that are an initial application. Fortunately, it seems as if any SFA recipient that might have had to repay a portion of the grant due to census issues has done so at this point. There have been no payments of excess funds since last September.
There has not yet been a public, plan‑by‑plan PBGC resolution of the mass‑withdrawal‑terminated plans on the SFA waitlist. As previously mentioned, the legal landscape has changed (2025) which puts pressure on the PBGC oversight. What changed from the original interpretation of “eligible plans” was the Second Circuit’s decision held that the SFA statute does not exclude multiemployer plans that had previously terminated by mass withdrawal, reversing PBGC’s denial of SFA to a fund that terminated in 2016. Furthermore, the court read ARPA’s “critical and declining” language to focus on status in the 2020–2022 window, and rejected PBGC’s position that lack of ongoing “zone status” or prior termination automatically barred eligibility.
As a result, the PBGC’s Office of Inspector General (OIG) issued a 2025 risk advisory flagging that the appellate decision opens the door for 123 terminated plans to seek SFA (80 currently on the waitlist), 91 of which are terminated and insolvent and 32 that are terminated but not yet insolvent and have not received traditional financial assistance. The OIG estimates that if SFA is ultimately provided to that group, gross SFA exposure could be on the order of billions of dollars. But, just think about the American Workers that might eventually recoup their promised benefits.
This post may be familiar to some of you, as I originally published it in October 2024. Given today’s great uncertainty related to geopolitics, markets, and the economy, I thought it relevant to share once again. Please don’t hesitate to reach out to me if you want to challenge any part of this list. We always welcome your feedback.
The four senior members at Ryan ALM, Inc. have collectively more than 160 years of pension/investment experience. We’ve lived through an incredible array of markets during our tenures. We have also witnessed many attempts on the part of Pension America to try various strategies to meet the promises that have been made to the pension plan participants.
Regrettably, defined benefit (DB) pension plans continue to be tossed aside by corporate America in favor of defined contribution (DC) plans. Both public and multiemployer plan sponsors would be wise to adopt a strategy that seeks more certainty to protect and preserve these critically important retirement vehicles before they are subject to a similar fate.
We’ve compiled a list of DB pension “Absolute Truths” that we believe return the management of pension plans back to its roots when SECURING the promised benefits at a reasonable cost and with prudent risk was the primary objective. The dramatic move away from the securing of benefits to the arms race focused on the return on asset assumption (ROA) has eliminated any notion of certainty in favor of far greater variability in likely outcomes.
Here are the Ryan ALM DB Truths:
Defined Benefit (DB) pension plans are the best retirement vehicle!
They exist to fulfill a financial promise that has been made to the plan participant upon retirement.
The primary objective in managing a DB plan is to SECURE the promised benefits at a reasonable cost and with prudent risk.
The promised benefit payments are liabilities of the pension plan sponsor.
Liabilities need to be measured, monitored, and managed more than just once per year.
Liabilities are future value (FV) obligations – a $1,000 monthly benefit is $1,000 no matter what interest rates do. As a result, they are not interest rate sensitive.
Pension inflation is not equal to the CPI but a rate unique to each plan sponsor.
Best way to hedge pension inflation is through Cash Flow Matching (CFM) since inflation is in the actuarial projections
Plan assets (stocks, bonds, real estate, etc.) are present value (PV) or market value (MV) calculations. We do not know the FV of assets except for a bond’s cash flows (interest and principal at maturity).
To measure and monitor the funded status, liabilities need to be converted from FV to PV – a Custom Liability Index (CLI) is absolutely needed.
A discount rate is used to create a PV for liabilities – ROA (publics), ASC 715 (corps), STRIPS, etc.
Liabilities are bond-like in nature. The PV of future liabilities rises and falls with changes in the discount rate (interest rates).
The nearly 40-year decline in US interest rates beginning in 1982 crushed pension funding, as the growth rate for future liabilities far exceeded the growth rate of assets.
The allocation of plan assets should be separated into two buckets – Liquidity (beta) and Growth (alpha).
The liquidity assets should consist of a bond portfolio that matches (defeases) asset cash flows with the plan’s liability cash flows (benefits and expenses (B&E)).
This task is best accomplished through a CFM investment process.
The liquidity assets should be used to fund B&E chronologically buying time for the alpha assets to grow unencumbered in their quest to meet those faraway future liabilities not yet defeased by the liquidity assets.
The Growth assets will consist of all non-bonds, which can now grow unencumbered, as they are no longer a source of liquidity. Growth assets will fund those remaining future liabilities not yet defeased by the liquidity assets.
The Return on asset (ROA) assumption should be a calculated # derived through an Asset Exhaustion Test (AET)
Unfortunately, future contributions are not included in the Funded Ratio calculation, yet future liabilities are.
The pension plan’s asset allocation should be responsive to the plan’s funded status and not the ROA.
As the funded status improves, port alpha (profits) from the Growth portfolio into the Liquidity bucket (de-risk) extending the cash flow matching assignment and securing more promises.
This de-risking ensures that plans don’t continue to ride the asset allocation rollercoaster leading to volatile contribution costs.
DB plans are a great recruiting and retention tool for managing a sponsor’s labor force.
DB plans need to be protected and preserved, as asking untrained individuals to fund, manage, and then disburse a “benefit” through a Defined Contribution plan is poor policy.
Unfortunately, doing the same thing over and over and over is not working. A return to pension basics is critical.
You’ve made a promise: measure it – monitor it – manage it – and SECURE it…
Get off the pension funding rollercoaster – sleep well!