Does This Look Like Success?

By: Russ Kamp, Managing Director, Ryan ALM, Inc.

The following was a headline for a MarketWatch.com article, “The 401(k)’s success has been overlooked and will help even more Americans”, which I saw on a LinkedIn.com post earlier today. Sure, some American workers have benefited from their ability to fund a DC account, but the vast majority of Americans are struggling.

Does This look like success?
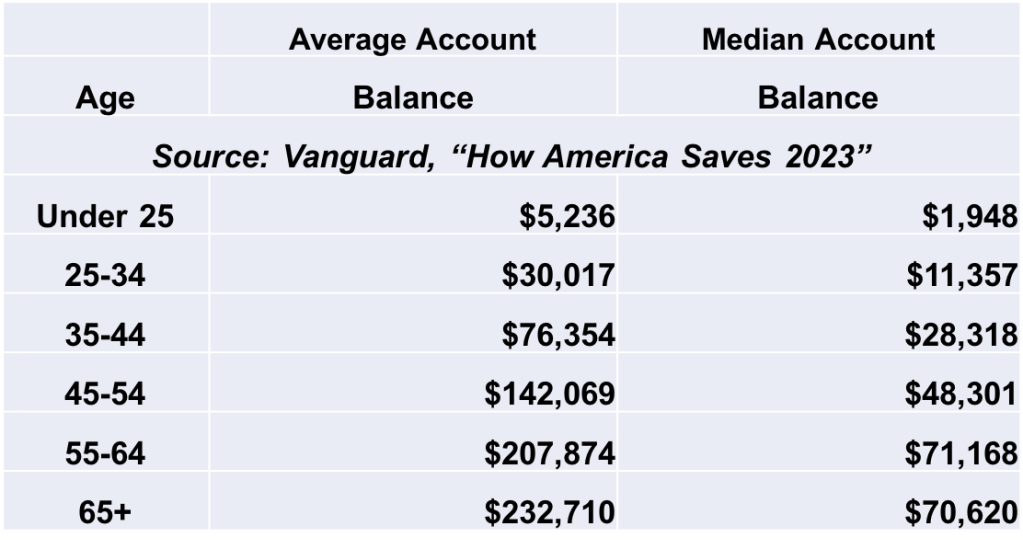
Perhaps the level of savings would be okay if DC plans were actually supplemental retirement vehicles, but since they have morphed into the primary retirement program for most workers, this is a disaster. I’m tired of the fact that we only ever see “average” balances reported. Of course, a few well-funded balances will drive the average up. Let’s focus on the MEDIAN account balances. Does a $70,620 account balance for a 65+ year-old participant look like a successful outcome? How much would that balance provide on a monthly basis for a roughly 20-year retirement?

If I were fortunate to have a defined benefit plan that provided $2,000/month (which isn’t a lot) for 20-years, I would receive $480K in retirement which is 6.8Xs what the 65+ year-old with the median account balance has today. It is a far cry when compared to the view that $1.4 million is the balance needed to have a dignified retirement today. It is silly to believe that the average American has the disposable income, investment acumen, and predictive ability to gauge how long they will live in order to allocate this meager balance to ensure that the recipient doesn’t outlive their savings.

The investment industry can celebrate all they want as it relates to the total accumulated wealth in defined contribution plans, but for the “median” American, it just isn’t close to being enough. Defined benefit plans should be the backbone of our retirement system, while DC plans occupy the supplemental role for which they were designed. As someone in that LinkedIn.com post stated, “the numbers don’t lie”. I would certainly agree, but that doesn’t mean that the #s are revealing success!

Kinda Silly Question

By: Russ Kamp, Managing Director, Ryan ALM, Inc.

If you ask the average person the following questions, I suspect that most people would answer in the affirmative.

Are you handsome?

Are you intelligent?

Are you honest?

So, I found it somewhat humorous when I saw the headline from a recent conference that said, “Private Credit managers say their is more room for growth”. Are you surprised? How many investment management organizations turn down new business when it presents itself? Does it really matter that private debt has seen something like 10X asset growth in the last couple of decades? Perhaps these managers have such a unique niche that they honestly believe that their product can manage through any challenge, especially one as “trivial” as natural capacity. How many times have you heard the following: “Our maximum capacity that we previously cited was just a target amount. Now that we actually have assets under management, it is clearer that we have much more capacity than initially anticipated.” Seems convenient, doesn’t it?

I can recall a few difficult conversations with both sales and senior management when I was leading an investment team at a previous shop. Our research and portfolio management teams did an outstanding job of determining the appropriate capacity for each strategy, and we had 50+ optimizations that each represented a strategy/product. We were particularly cognizant of the capacity associated with our market neutral product, which was roughly $3 billion in AUM. We had to be most careful with shorting stocks given the borrowing rates being charged by our prime brokers. The size of trades were always a concern. Yet, it really didn’t matter to outside parties that just wanted to see assets flow into our products. It didn’t matter whether or not we would be able to generate the return/risk characteristics as previously defined by our investment team.

These awkward conversations occur all too frequently, especially for investment companies that are public and have quarterly earnings expectations that must be met. I’ve never understood how the investment management industry can claim to be “long-term” investors yet be driven by quarter-to-quarter earnings announcements that impact the investment teams when layoffs are announced. Has our industry just morphed into a number of large sales organizations? Do we have “investment” firms focused on generating appropriate return and risk characteristics? Do these firms truly understand the capacity based on trading metrics?

I don’t work for a company that participates in the Private Credit arena. I couldn’t tell you whether or not there remains adequate capacity to enable managers in that space to generate decent return and risk characteristics. But asking managers in that space whether or not they can take on more assets and generate more fees is kinda silly. I hope that the asset consulting community has the tools to evaluate capacity for not only this asset class, but any other being considered for use in a DB pension. Given that most “active” managers have failed over time to generate a return in excess of their respective benchmark, I would hazard a guess that the natural capacity for their strategy has been eclipsed. These excess assets lead to ever increasing trading costs of market impact and time delays (not commissions). Couple those costs with the fees that active managers charge and you create a hurdle that is difficult to overcome.

He Said What?

By: Russ Kamp, Managing Director, Ryan ALM, Inc.

I’d like to thank Bill Gross for his honest assessment that he just provided on the likely failure of “Total Return” bond products going forward. Here are his thoughts that were summarized in a Bloomberg Business email:

Bill Gross says his “total return” strategy—the one that revolutionized the bond market— “is dead”! Instead of just picking up steady interest payments like his peers did at the time, the co-founder of Pacific Investment Management created the firm’s Total Return Fund in 1987 to take active positions in duration, credit risk and volatility. The idea is that, more than just clipping coupons, bond investors can also benefit from capital appreciation as bond prices rise and yields fall. But in an outlook published Thursday, Gross noted what’s different now is that yields are much lower than when he first coined the concept, leaving investors with less room for price appreciation. 

We’ve been stressing this point for a long time now. Bonds should be used for the certainty of cash flows that they produce of interest and principal. Those cash flows are known and can be modeled with certainty (barring no defaults) to meet the liability cash flows of a pension plan (benefits) or foundation (grants). As Gross rightly points out, given the current level of US interest rates and inflation, just how much appreciation can be achieved, if an investor is on the correct side of a duration bet.

Capital market participants benefited tremendously during the nearly four decades decline in rates from 1981 to 2021. That move down in rates was certainly great for “total return” bond programs, but it also acted as rocket fuel for risk assets. What most market participants have either forgotten or don’t know is the fact that US interest rates trended higher for 28 years prior to the peak achieved in 1981. They are used to the Fed stepping into the fray every time there was a wiggle or wobble in the markets. Well, those days might be behind us.

Yes, US employment came in light this morning with 175k jobs being created in April when the forecast was for 240k, but that is one data point. We certainly witnessed an aggressive move down in rates during 2023’s fourth quarter only to see most of that move reversed to start 2024. Was your bond program able to get both directions correct or did your portfolio get whipsawed? Wouldn’t it be more comforting to know that you can install a cash flow matching portfolio that will SECURE the promises that have been made to the plan participants without having to guess the direction of rates? Even if one were to guess correctly, just how far will rates fall given that inflation remains sticky? Are you likely to see negative real yields?

The US economy remains robust. Fiscal policy remains easy with excessive Government spending and in direct competition with monetary policy. The labor market continues to be strong, as is wage growth. The stock market’s performance continues to support the economy. Given these realities, why should US rates plummet, which is what it would take to create an investing horizon that would be supportive of “total return” fixed income products.

CFM: Buy Time and Reduce Risk

By: Russ Kamp, Managing Director, Ryan ALM, Inc.

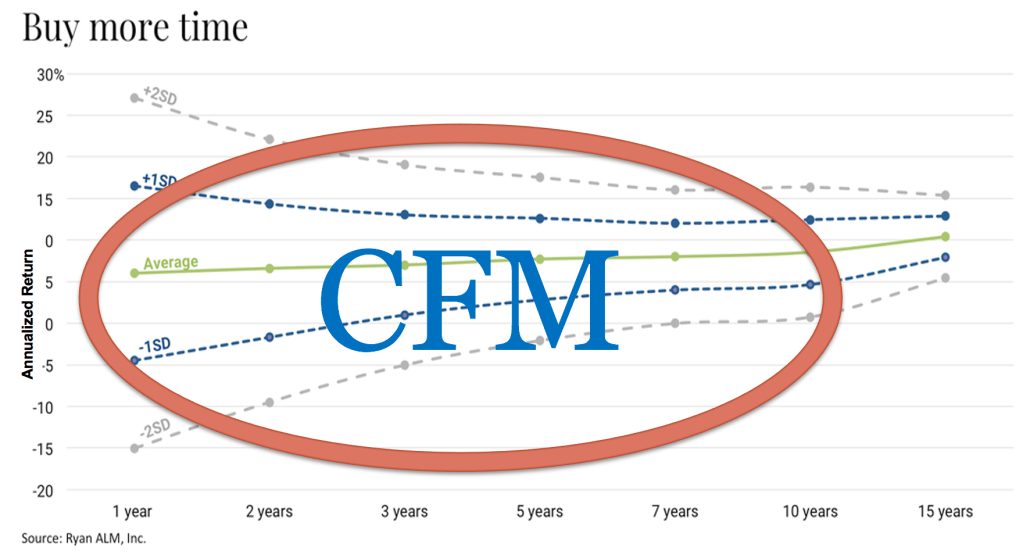
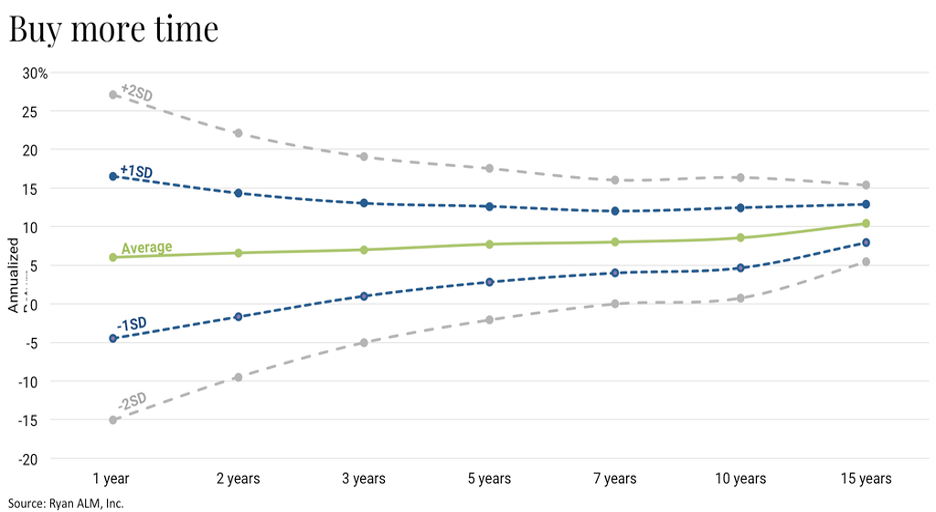
A traditional DB plan’s asset allocation comes with a lot of annual volatility (see the graph below). That volatility gets reduced as one extends the investing horizon, but it is still quite uncertain until you extend sufficiently, such as 10 or more years. However, as plan sponsors and investment managers, we have been living in a quarter-to-quarter measurement cycle for decades. In that environment, a 1 standard deviation (1 SD) measurement for a 1-year time frame (Ryan ALM asset allocation model since 1999) is +/- 10.5%. In the example below, 68% of the observations (1 SD) will fall between 16.5% and -4.5%. A 2 SD measurement would have the range for 95% of the observations between 27% and -15%. That gap, or should I say canyon, is a 1-year observation. Extend the measurement period to 5-years and the range of results is still wide but less so at +/- 9.8% for 2 SDs. It isn’t until you get beyond 10 years that the volatility associated with a fairly traditional asset allocation gets to a reasonable level.

Is there a way to bring more certainty to the asset allocation process that would allow for longer observation periods and less volatility? Absolutely! A plan sponsor and their advisors can adopt a bifurcated asset allocation in which a liquidity bucket is created that will fund and match the plan’s liability cash flows of benefits and expenses chronologically from the next month as far out as the allocation will cover (10+ years) allowing for the remainder of the alpha assets (all non-bond assets) to now grow unencumbered. The task for those assets is to meet future liabilities.

As the graph below highlights, a carefully constructed cash flow matching (CFM) portfolio can help plan sponsors wade through the volatility associated with shorter timeframes. The CFM portfolio will consist of investment grade bonds whose cash flows of interest and principal will be matched to the liability cash flows. This process now ensures (absent defaults) that the necessary liquidity is available when needed as those future promises have been SECURED. The remaining assets can now be managed as aggressively as the plan’s funded status dictates.

With this process, short-term market dislocations will no longer impact the plan’s ability to meet its obligations. There will be no forced selling to meet benefit payments. The alpha assets can now grow without fear of being sold at an unreasonable level. The CFM program takes care of your needs while establishing a buffer (longer investing horizon) from market corrections that happen on a fairly regular basis. This structure should also lead to less volatility related to contributions and the plan’s funded status.

Given the elevated US interest rate environment, now is the time to engage in this process. CFM will provide a level of certainty that doesn’t exist in a traditional asset allocation. This is a “sleep well at night” strategy that should become the core holding for DB pensions. As I mentioned in an earlier blog post today, bonds should only be used for the cash flows they produce. They should not be used as total return-seeking instruments. Leave that task to the alpha assets that will benefit from a longer investing period.

Another Challenging Month for US Fixed Income

By: Russ Kamp, Managing Director, Ryan ALM, Inc.

S&P Dow Jones is out with its monthly “Dash Board” on a variety of benchmarks, both domestic and foreign. April proved challenging for both US equities and bonds. With regard to stocks, the S&P 500 was down -4.1% bringing the YTD performance to +6.04%. It was a tougher environment for both mid cap (-6.0%) and small cap (-5.6%). Small caps (S&P 600) continue to be pressured and the index is now down -3.3% YTD. As US interest rates continue on a course higher, US equities will continue to be challenged.

The higher US rates are also continuing to pressure US fixed income. The Aggregate Index produced a -1.8% April, and the index is now down -2.4% since the start of 2024 despite the rather robust YTM of 5.3%. As we’ve discussed on many occasions, bonds are the only asset class with a known cash flow of a terminal value and contractual coupon payments. As a result, bonds should be used for the certainty of those cash flows and specifically to defease pension liabilities. As a reminder, pension liabilities are bond-like in nature and they will move with changes in interest rates. Don’t use bonds as a total return strategy, as they will not perform in a rising rate environment. Sure, the nearly 40-year decline in rates made bonds and their historical performance look wonderful, but that secular trend is over.

Use the fixed income allocation to match asset cash flows of interest and principal to the liability cash flows of benefits and expenses. As a result, that portion of the total assets portfolio will have mitigated interest rate risk, while SECURING the promised benefits. Having ample liquidity is essential. Using bonds to defease pension liabilities ensures that the necessary liquidity will be available as needed. The current US interest rate environment may be pressuring total return-seeking fixed income managers, but it is proving cash flow matching programs with a very healthy YTM that dramatically reduces the cost of those future value payments. Don’t waste this golden opportunity.

Healthier Than Ever? Nah!

By: Russ Kamp, Managing Director, Ryan ALM, Inc.

P&I produced an article yesterday titled, “Corporate Pension Funds Are Fully Funded, Healthier Than Ever. Now What?” According to Milliman, corporate pension plans are averaging roughly a funded ratio of 106%. This represents a healthy funded status, but it is by no means the healthiest ever. One may recall that corporate plans were funded in excess of 120% as recently as 2000. In what might be more shocking news, public pension plans were too when using a market discount rate (ASC 715 discount rate). Today, those public pension plans have a funded status of roughly 80% according to Milliman’s latest public fund report.

The question, “Now what”? is absolutely the right question to be asking. Many corporate plans have already begun de-risking, as the average exposure to fixed income is >45% according to P&I’s asset allocation survey through November 2023. Unfortunately, public pension systems still sit with only about 18% exposure to US fixed income, preferring a “let it ride” mentality as equities and alternatives account for more than 75% of the average plan’s asset allocation. Is this the right move? No. The move into alternatives has dried up liquidity, increased fees, and reduced transparency. Furthermore, just because a public plan believes that its sponsor is perpetual, does that make the system sustainable? You may want to be reminded about Jacksonville Police and Fire. There are other examples, too.

Whether the pension plan is corporate, multiemployer, or public, the asset allocation should reflect the funded status. There is no reason that a 60% funded plan should have the same asset allocation as one that is 90% or better funded. All plans should have both liquidity and growth buckets. The liquidity bucket will be a bond allocation (investment grade corporates in our case) that matches asset cash flows to liability cash flows of benefits and expenses. That bucket will provide all of the necessary liquidity as far into the future as the pension system can afford. The remaining assets will be focused on outperforming future liability growth. These assets will be non-bonds that now have the benefit of an extended investing horizon to grow unencumbered. Forcing liquidity in environments in which natural liquidity has been compromised only serves to exacerbate the downward spiral.

Pension America has the opportunity to stabilize the funded status and contribution expenses. They also have the chance to SECURE a portion of the promises. How comforting! We saw this movie a little more than 20 years ago. Are we going to treat this opportunity as a Ground Hog Day event and do nothing or are we going to be thoughtful in taking appropriate measures to reduce risk before the markets bludgeon the funded status? The time to act is now. Not after the fact.

Milliman Reports Improved Funding For Public Fund Pension Plans as of March 31, 2024

By: Russ Kamp, Managing Director, Ryan ALM, Inc.

Milliman recently released results for its Public Pension Funding Index (PPFI), which covers the nation’s 100 largest public defined benefit plans.

Positive equity market performance in March increased the Milliman 100 PPFI funded ratio from 78.6% at the end of February to 79.7% as of March 31, representing the highest level since March 31, 2022, prior to the Fed’s aggressive rate increases. The previous high-water mark stood at 82.7%. The improved funding for Milliman’s PPFI plans was driven by an estimated 1.7% aggregate return for March 2024. Total fund performance for these 100 public plans ranged from an estimated 0.9% to 2.6% for the month. As a result of the relatively strong performance, PPFI plans gained approximately $85 billion in MV in March. The asset growth was offset by negative cash flow amounting to about $9 billion. It is estimated that the current asset shortfall relative to accrued liabilities is about $1.271 trillion as of March 31. 

In addition, it was reported that an additional 4 of the PPFI members had achieved a 90% or better funded status, while regrettably, 15 of the constituents remain at <60%. Given that changing US interest rates do not impact the calculation for pension liabilities under GASB accounting, the improvement in March’s collective funded status may be underreported, as US rates continued the upward trajectory begun as the calendar turned to 2024.

Tricky? Not Sure Why!

By: Russ Kamp, Managing Director, Ryan ALM, Inc.

The WSJ produced an article on April 22, 2024 titled, “Path for 10-Year U.S. Treasury Yield to 5% Is Possible but Tricky” At the time of publication, the 10-year Treasury note yield was just under 4.7%. It is currently at 4.66%. Those providing commentary talked about the need to further reduce expectations for potential rate cuts of another 25 to 40 basis points. As you may recall, there were significantly greater forecasts of rate cuts at the beginning of 2024, but those have been scaled back in dramatic fashion.

Given the current inflationary landscape in which the Consumer Price Index for All Urban Consumers (CPI-U) increased 0.4 percent in March and 3.5% annually, a move toward 5% for the US 10-year Treasury note’s yield shouldn’t be surprising or tricky. According to the graph below, the US 10-year yield has averaged a “real” yield of nearly 2% (1.934%) since 1984. A 2% inflation premium would place today’s 10-year Treasury note yield at roughly 5.6%.

Given the current economic conditions (2.9% GDP growth for Q1’24) and labor market strength (3.8% unemployment rate), it certainly doesn’t seem like the Fed’s “aggressive” action elevating the Fed Funds Rate from 0 to 5.5% today has had the impact that was anticipated. Inflation in 2024 has been sticky and may in fact be increasing. Should geopolitical issues grow in magnitude, inflation may get worse. These current conditions don’t say to me that a move to a 5% 10-year Treasury note yield should be tricky at all. As a reminder, the yield on this note hit 4.99% in late October 2023. Financial conditions have not gotten more restrictive since then.

Should the Treasury yield curve ratchet higher, with the 10-year eventually eclipsing 5%, plan sponsors would have a wonderful opportunity to secure the future promised benefits at significantly reduced cost in present value terms, especially if the cash flow matching portfolio used investment grade corporate bonds with premium yields. Although US corporate bond spreads are tight relative to average spreads, they still provide a healthy premium. Don’t let this rate environment pass without taking some risk from your plan’s asset allocation. We’ve seen that scenario unfold before and the outcome is scary.

What’s the Motivation?

By: Russ Kamp, Managing Director, Ryan ALM, Inc.

There appears in the WSJ today an article stating that pension plans were pulling “hundreds of billions from stocks”. According to a Goldman analyst, “pensions will unload $325 billion in stocks this year, up from $191 billion in 2023″. We are told that proceeds from these sales will flow to both bonds and alternatives. First question: What is this estimate based on? Are average allocations now above policy normal levels necessitating a rebalancing? Are bonds more attractive given recent movements in yields?

Yes, equities have continued to rally through 2024’s first quarter, and the S&P 500 established new highs before recently pulling back. Valuations seem stretched, but the same argument could have been made at the end of 2023. Furthermore, US interest rates were higher heading into 2023’s fourth quarter. If bond yields were an attractive alternative to owning equities, that would have seemed the time to rotate out of equities.

The combination of higher interest rates and equity valuations have helped Corporate America’s pensions achieve a higher funded status, and according to Milliman, the largest plans are now more than 105% funded. It makes sense that the sponsors of these plans would be rotating from equities into bonds to secure that funded status and the benefit promises. Hopefully, they have chosen to use a cash flow matching (CFM) strategy to accomplish the objective. Not surprisingly, public pension plans are taking a different approach. Instead of securing the benefits and stabilizing the plan’s funded status and contribution expenses by rotating into bonds, they are migrating both equities and bonds into more alternatives, which have been the recipients of a major asset rotation during the last 1-2 decades, as the focus there remains one of return. Is this wise?

I don’t know how much of that estimated $325 billion is being pulled from corporate versus public plans, but I would suggest that much of the alternative environment has already been overwhelmed by asset flows. I’ve witnessed this phenomenon many times in my more than 40 years in the business. We, as an industry, have the tendency to arbitrage away our own insights by capturing more assets than an asset class can naturally absorb. Furthermore, the migration of assets to alternatives impacts the liquidity available for plans to meet ongoing benefits and expenses. Should a market correction occur, and they often do, liquidity becomes hard to find. Forced sales in order to meet cash flow needs only serve to exacerbate price declines.

Pension plans should remember that they only exist to meet a promise that has been made to the participant. The objective should be to SECURE those promises at a reasonable cost and with prudent risk. It is not a return game. Asset allocation decisions should absolutely be driven by the plan’s funded status and ability to contribute. They shouldn’t be driven by the ROA. Remember that alternative investments are being made in the same investing environment as public equities and bonds. If market conditions aren’t supportive of the latter investments, why does it make sense to invest in alternatives? Is it the lack of transparency? Or the fact that the evaluation period is now 10 or more years? It surely isn’t because of the fees being paid to the managers of “alternative” products are so attractive.

Don’t continue to ride the asset allocation rollercoaster that only ensures volatility, not success! The 1990’s were a great decade that was followed by the ’00s, in which the S&P 500 produced a roughly 2% annualized return. The ’10s were terrific, but mainly because stocks were rebounding from the horrors of the previous decade. I don’t know what the 2020s will provide, but rarely do we have back-to-back above average performing decades. Yes, the ’90s followed a strong ’80s, but that was primarily fueled by rapidly declining interest rates. We don’t have that scenario at this time. Why assume the risk?

The Truth Will Set You Free!

By: Russ Kamp, Managing Director, Ryan ALM, Inc.

Managing a pension plan should be all about securing the promised benefits at a reasonable cost and with prudent risk. I believe that most plan sponsors would agree, yet that is not how plans are managed, especially public and multiemployer plans that continue to pursue the return on asset assumption (ROA) as if it were the Holy Grail. I’ve written quite a bit on this subject, including discussing asset consulting reports that should have the relationship of plan assets to plan liabilities on page one of the quarterly performance reports.

We know that pension liabilities are like snowflakes, as there are no two pension liability streams that are the same given the unique characteristics of each labor force. Furthermore, most pension actuaries only produce an annual update making more frequent (monthly/quarterly) updates more challenging. Would plan sponsors want a more frequent view of the liabilities if they were available? I think that they would. Again, if securing the promised benefits are the primary objective when it comes to managing a pension plan, then plan sponsors need a more frequent view of the relationship between assets and liabilities.

Why is this important? First and foremost, the capital markets are constantly moving, and the changes impact the value of the plan’s assets all the time. But it isn’t just the asset-side that is being impacted, as liabilities are bond-like in nature and they change as interest rates change. We’ve highlighted this activity in both the Ryan ALM Pension Monitor and the Ryan ALM Quarterly Newsletter. However, accounting rules for both multiemployer and public plans allow a static discount rate equivalent to the plan’s ROA to be used that hides the impact of those changing interest rates on the value of a plan’s liabilities and funded status.

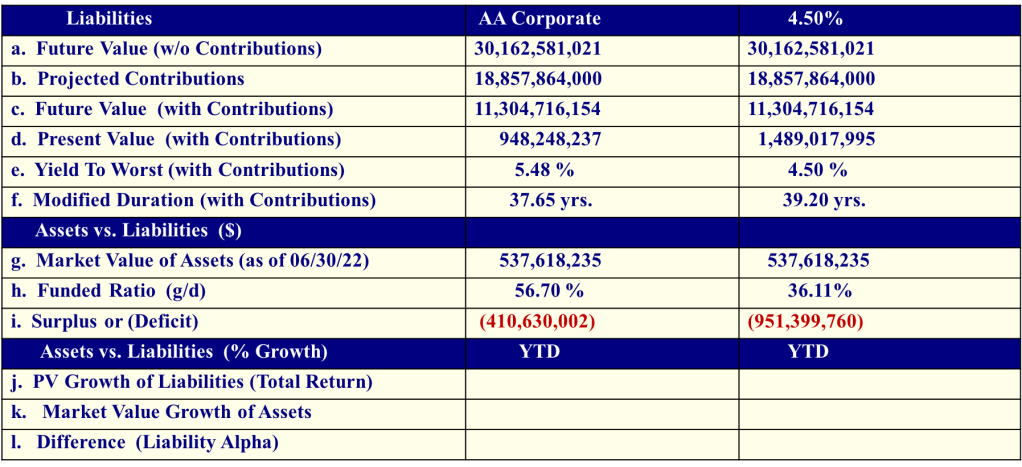
What if a more frequent analysis was available at a modest cost. Would plan sponsors want to see how the funded status was behaving? Would they want that comparison available to help with asset allocation changes, especially if it meant reducing risk as funding improved? I suspect that they would. Well, there is good news. Ryan ALM, Inc. created a Custom Liability Index (CLI) in 1991. The CLI is designed to be the proper benchmark for liability driven objectives. The CLI calculates the present value of liabilities based on numerous discount rates (ASC 715 (FAS 158), PPA – MAP 21, PPA – Spot Rates, GASB 67, Treasury STRIPS and the ROA). The CLI calculates the growth rate, summary statistics, and interest rate sensitivity as a series of monthly or quarterly reports depending on the client’s desired frequency.

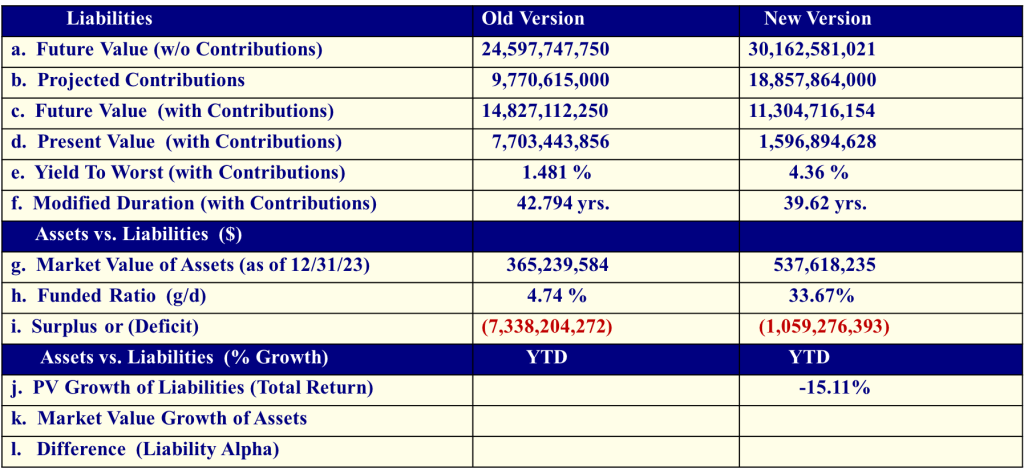
The above information is for an actual client, who we’ve been providing a CLI for 15+ years. This client has elected to receive quarterly reviews. They’ve also chosen to see the impact on liabilities for multiple discount rates, including a constant 4.5% ROA, which could easily be a pension plan’s ROA of say 7%. As you will note, the present value (PV) of those future value (FV) liabilities are different, and they could be dramatic, depending on the interest rate used. In this case, the AA Corporate rate (5.48% YTW) produces a funded ratio of 56.7%, while the flat 4.5% rate increases the PV liabilities thus reducing the funded status by more than 20%.

Using Treasury STRIPS as the discount rate produces the lowest funded ratio of 33.7% or 23% lower than using the AA Corporate discount rate.

With this information, plan sponsors and their advisors (consultants and actuaries) can make informed decisions related to contributions and asset allocation. Most plan sponsors are currently blind to these facts. As a result, decisions may be taken without having all of the necessary facts. Pension plans need to be protected and preserved (Ryan ALM’s mission). Having a complete understanding of what those future promises look like is essential.

You’ve made a promise: measure it – monitor it – manage it – and SECURE it…   

Get off the pension funding rollercoaster – sleep well!