By: Russ Kamp, CEO, Ryan ALM, Inc.
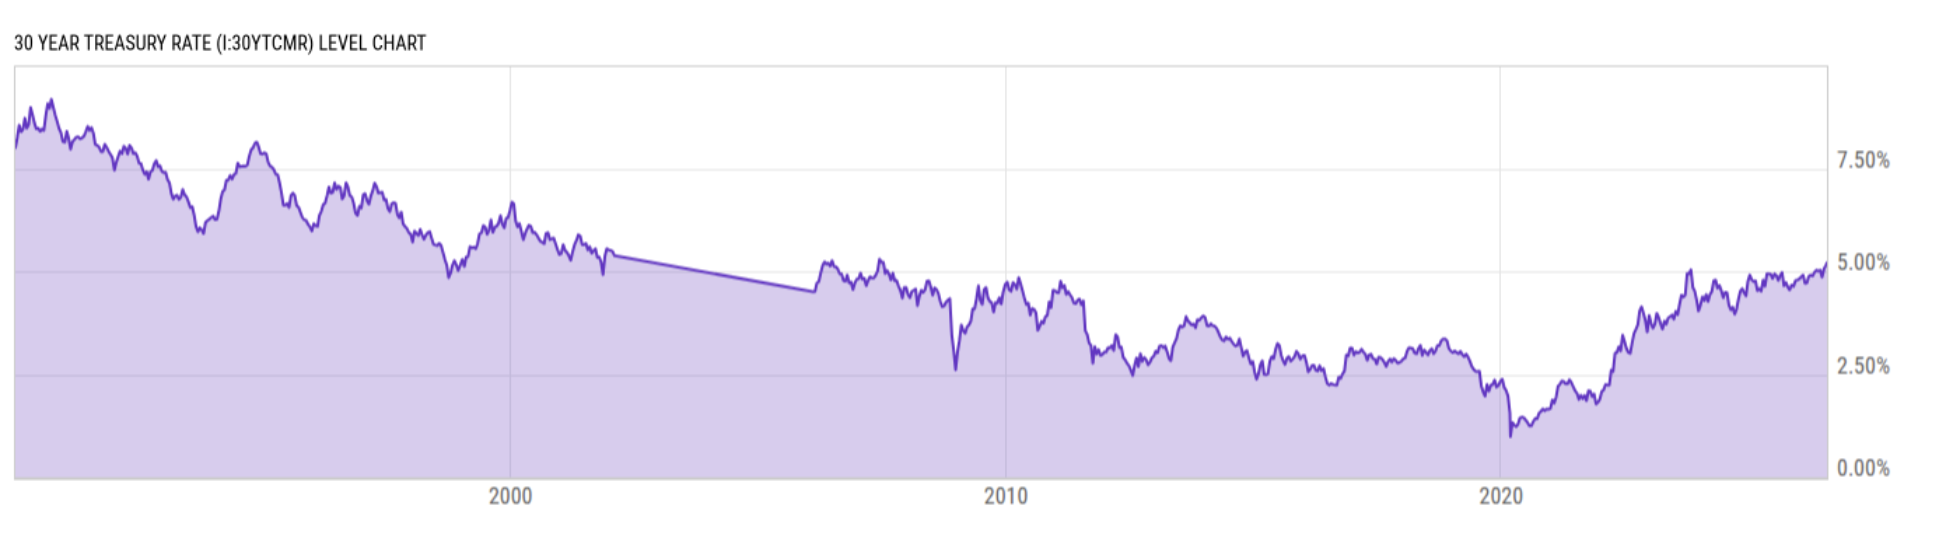
Due to great uncertainty brought on by the conflict in the Middle East and the war’s potential impact on the price of oil ($85.63 at 10:01 EST) that could drive inflation higher, U.S. long-dated Treasury yields continue to rise. In fact, the U.S. 30-year Treasury yield has not been this high (5.26%) since July 6, 2007, when the yield was at 5.28%. Where yields go from here is anyone’s guess, but I will share that oil, as represented by WTI, has risen 24.9% since June 30, 2026. Given the exposure that oil or oil-derived inputs have in more than 6,000 products, the significant rise in the recent price could impact inflation for quite some time, even if oil soon began to flow more freely.
We recently saw the average 30-year BBB+ bond trading at 110 bps above the prevailing 30-year Treasury. If that relationship is maintained, pension plans could potentially cover most of their desired return on asset (ROA) annual target (average public pension plan has a 6.75% ROA) through bonds. Should inflation spike once again, there is no telling how high U.S. interest rates could rise. Despite domestic equity’s apparent immunity to market fundamentals and geopolitical risks, there will come a time when higher U.S. yields become too attractive to ignore leading to the potential for rebalancing out of equities into fixed income. That action will likely lead to lower equity prices and falling bond yields.
So, I ask, why wait? Why wait to take risk from your current asset allocation before the markets act? Why not SECURE your benefit promises through cash flow matching (CFM) well into the future and reduce the volatility related to returns, contributions, and funded status? Why not take advantage of very attractive bond yields? As a reminder, core, active fixed income strategies are highly interest rate sensitive. Rising yields negatively impact bond prices, as seen in the performance of the Aggregate Bond Index, which is up only 0.1% annually for the 5-years ending June 30, 2026. However, a CFM strategy, which secures benefits that are future values, eliminates interest rate risk, as future values are not interest rate sensitive.
Public pension plans have done a good job of improving their funded ratios since bottoming after the Great Financial Crisis but remain only one market crash away from repeating this vicious cycle. Get off the performance rollercoaster. Secure your promises chronologically for some period into the future (your plan’s funded status should dictate the allocation). You and your participants will sleep much better knowing that the promises made will be kept.