
By: Russ Kamp, CEO, Ryan ALM, Inc.
U.S. equity markets enjoyed a robust April despite myriad economic and geopolitical inputs that might have given investors pause. Should equity investors remain bullish at this time? The graph below caught my attention primarily because of the recent disconnect between the two lines related to the Shiller Excess Cape Yield (ECY) and subsequent 10-year Real Return for equities. There are many, many valuation tools that claim to provide clues about the future direction of stocks, and this is such an example. Those tools can be short-, medium-, and long-term in nature. The ECY happens to be one valuation metric that provides “guidance” for longer time frames. The current reading of 1.60% certainly looks rich relative to its long history.
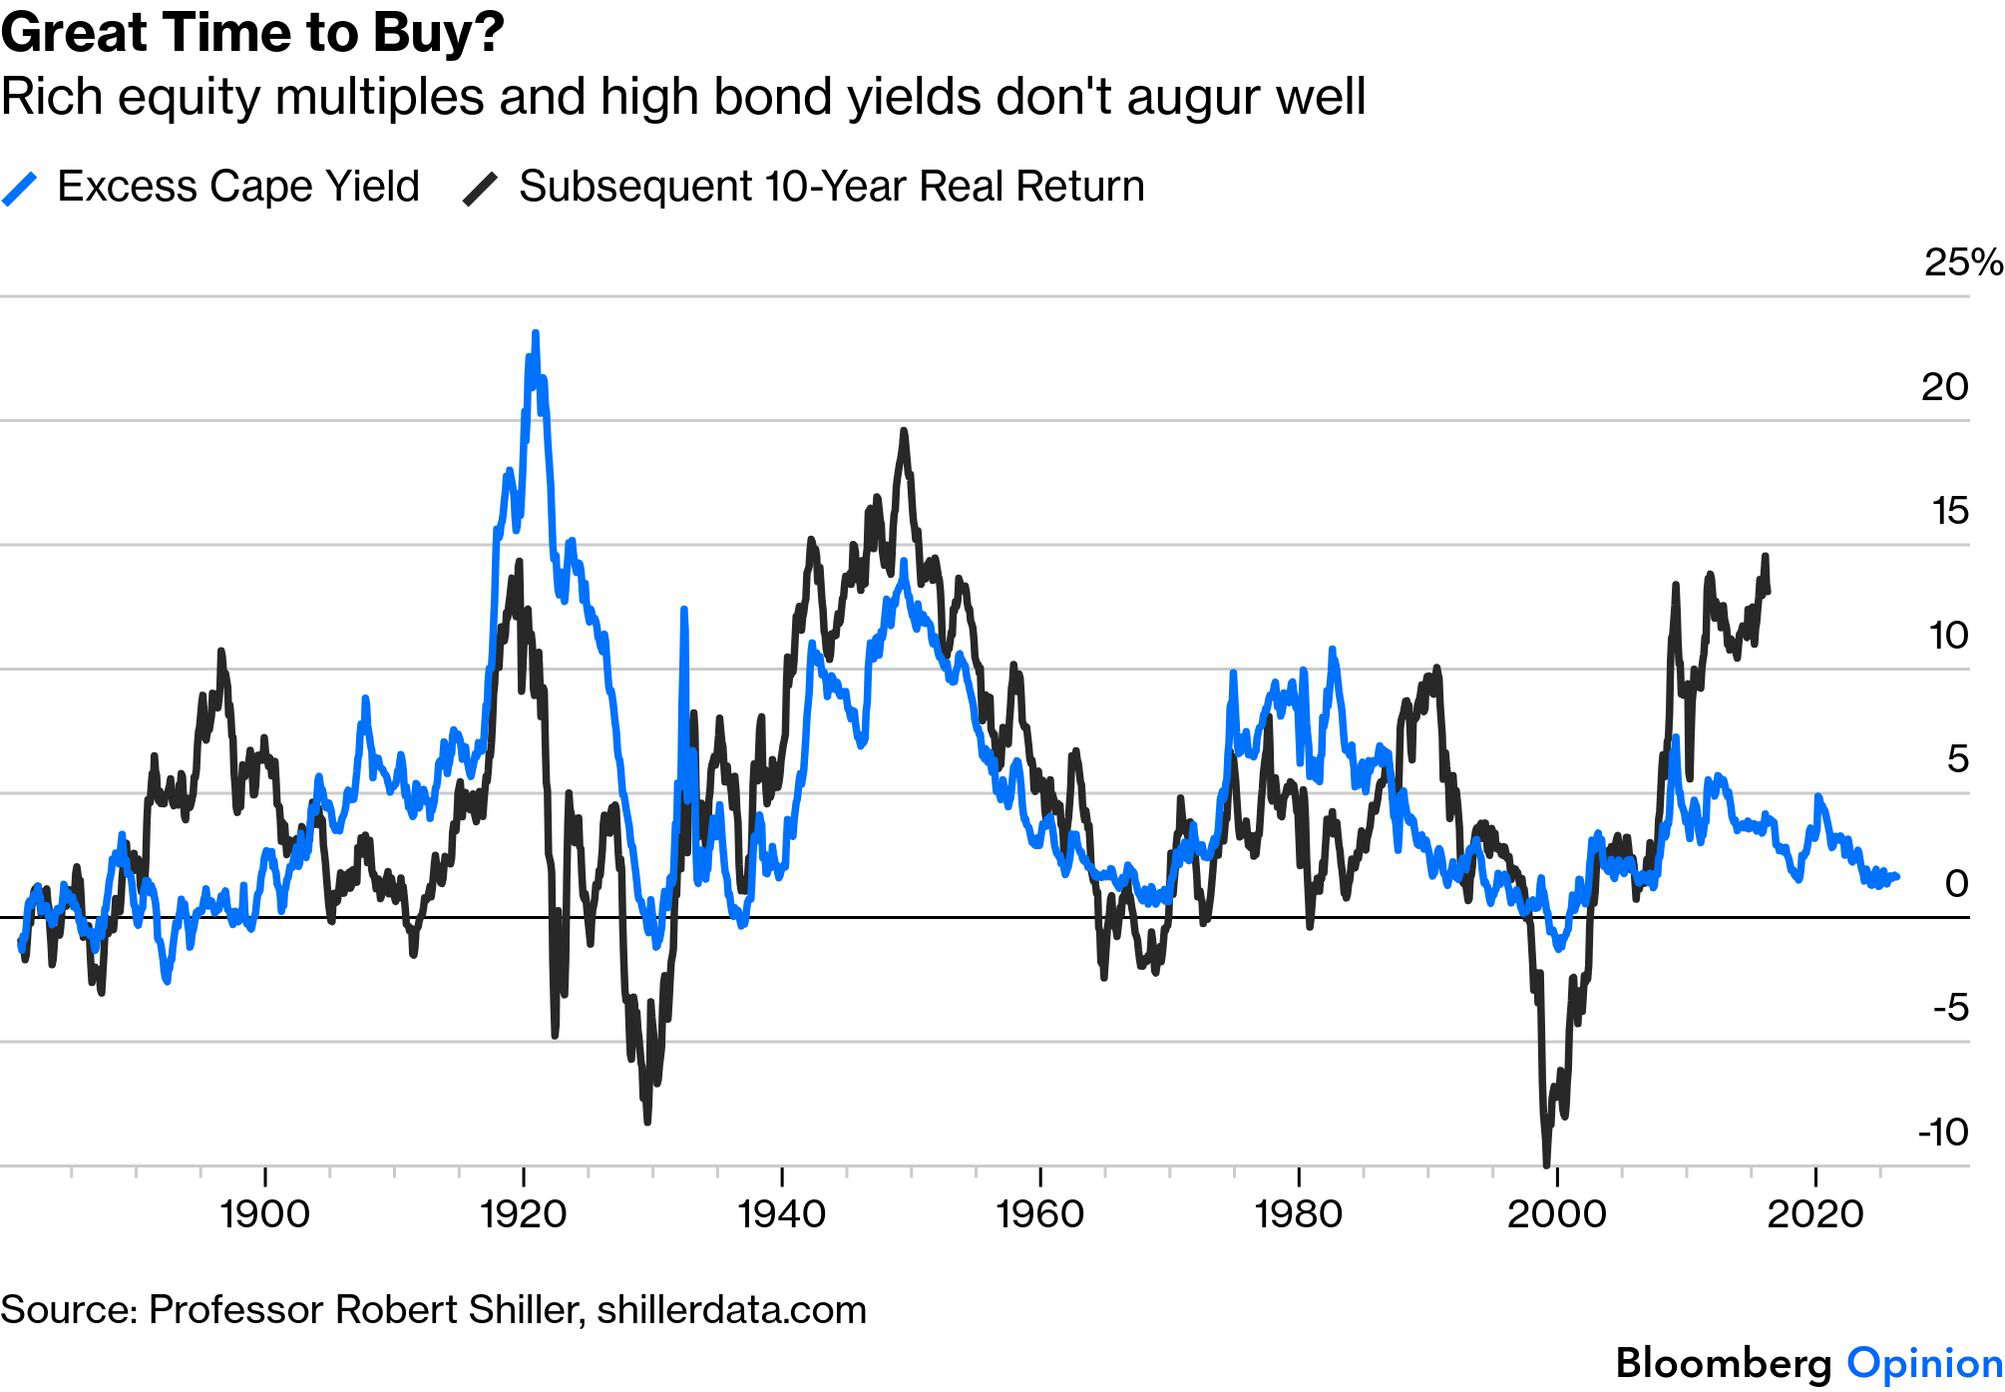
In case you don’t know, the Shiller excess CAPE yield is a valuation measure that compares the stock market’s earnings yield with the “real” yield on the 10-year Treasury note. In simple terms, it asks how much extra return stocks may offer over inflation-adjusted government bonds.
How it is calculated
- Take the inverse of the CAPE ratio, which is the market’s “earnings yield.”
- Subtract the real 10-year Treasury yield.
A higher excess CAPE yield suggests stocks might look more attractive relative to bonds. A lower reading suggests the equity risk premium is thinner, meaning stocks offer less return versus bonds. As mentioned above, current readings show the S&P 500 Shiller Excess CAPE Yield around 1.60% for April 2026, which is well below its long-term average of 4.60%. Another data source put it at 1.41 as of April 30, 2026.
Investors have historically used the ECY as a long-term asset allocation tool, especially when comparing stocks with Treasury bonds. It is not a short-term trading signal, but rather a rough guide to whether equities look cheap or expensive relative to real bond yields. A CAPE yield below 2% has generally signaled subdued future equity returns over the next 5 to 10 years, providing a valuation warning sign, and not an exact measure.
As a reminder, there are many valuation techniques used to identify opportunities and risk when investing in U.S. equities. Depending on a pension plan’s liquidity needs, funded ratio, willingness to take risk, etc. today’s current environment may be providing an opportunity to reduce risk by trimming equities and using the proceeds along with core fixed income assets to establish a cash flow matching mandate. In the process, the plan’s liquidity is improved, promised benefits secured, and the investing horizon extended for the residual assets. Give us a call. We are always willing to provide a free analysis showcasing how CFM can help your fund.
