It Should Be Relative and NOT Absolute

By: Russ Kamp, CEO, Ryan ALM, Inc.

I was participating on a panel at the Opal/LATEC conference yesterday. The moderator asked a question about the importance of process. In my response, I mentioned a number of process elements that are critical to the successful management of pension plans. Here is one point that I made that doesn’t get the attention that it deserves. Many, if not most, defined benefit pension plans have created an investment policy statement (IPS) that specifically restricts certain investments and their respective weights within the pension fund. The plan sponsor and their consultant likely allow investments in public equities and certain styles of equity management (i.e. value and growth, large and small cap, etc.). However, in many cases they restrict the exposure to any one security by an absolute amount such as 5%. This is the wrong approach.

Limiting exposures does reduce the risk that any one stock could have an outsized impact on the pension plan’s return, but by doing so, the plan sponsor is potentially negatively impacting the investment manager. Not all U.S. equity benchmarks are the same and treating them as such is potentially damaging to the manager and fund.

If a large cap growth manager has been retained and they are asked to manage a portfolio relative to the Russell 1000 Growth Index, limiting exposure in a stock to 5% would mean forcing that manager to make a negative bet against any stock in the index that has a weight greater than 5%. As of today, there are three stocks – Nvidia (12.9%), Apple (11.6%), and Microsoft (8.8%) – that the manager couldn’t own at benchmark weight, let alone own them above the index weight. This index is cap weighted, and as the stocks perform well their weight in the index grows. Not being able to own the stock at its index weight is harmful.

Worse, if the investment manager wants to make a positive bet on the stock, they can’t, forcing them to potentially choose weaker companies to round out their portfolio. When a manager is chosen, they are often picked because of their past track record of producing an excess return for a level of risk (tracking error). Restricting exposures to an absolute weight may render those previous return/risk characteristics moot. Furthermore, the exposure to a single stock should be relative to the weight in the index +/- band, which would be very dependent on the amount of tracking error that is comfortable to the plan sponsor.

For instance, a good information ratio (excess return/tracking error) is 0.33%. Meaning that for every 1% excess return, the manager is taking 3% tracking error. If the manager is hoping to add 2% above the benchmark over a cycle, that manager is going to have a tracking error close to 6%. The relative weight of a stock in a portfolio must reflect that level of potential tracking error. Higher tracking error portfolios need more flexibility. In this case, it would make sense to allow the manager to invest in Nvidia at the index weight +/- 2%. For lower risk strategies such as an enhanced index that only has 1% tracking error, perhaps the index weight +/- 0.5% would be appropriate.

Now, the Russell 1000 Growth Index is one of the more concentrated indexes with nearly 60% of the weight of the index in just the top 10 holdings, but it isn’t the only one. Currently, the S&P 500 has the same three stocks (Nvidia, Apple, and Microsoft) at weights greater than 5% and two others, Amazon and Alphabet, at weights >3%. If the manager wants to overweight a holding in the S&P 500 by +/- 2%, they would be restricted with a 5% absolute restriction and no ability to overweight.

I recommend that you review your IPS and make sure that your “risk control” objectives are not restricting your manager’s ability to produce an excess return. Remove any absolute constraint and replace it with a relative weighting based on the tracking error that the manager produces. Again, lower risk enhanced index managers will only need a +/- 0.5% to +/-1% restriction, while higher tracking managers will need greater flexibility.
It’s Not A Product – It’s A Service!

By: Russ Kamp, CEO, Ryan ALM, Inc.

Anyone who has read my blogs (>1,700 to date) knows that my personal mission and that of Ryan ALM, Inc. is to protect and preserve defined benefit pension plans. How is our collective mission pursued? It is through the implementation of unique client-specific cash flow matching (CFM) assignments. Since every pension plan has liabilities unlike any other fund, a unique solution must be created unlike most investment management products sold today.

Here is the reality: There are a lot of wonderful people in our industry, representing impressive investment organizations, tasked with introducing a variety of investment products. Plan sponsor trustees, with the help of their investment consultants, must determine which products are necessary for their plan to help reach the goal of funding the promised benefits. This is an incredibly challenging exercise if the goal is to cobble together a collection of investment managers whose objective is to achieve a return on asset assumption (ROA). This exercise often places pension funds on the proverbial rollercoaster of returns. The pursuit of a return as the primary goal doesn’t guarantee success, but it does create volatility.

On the other hand, wouldn’t it be wonderful if one could invest in strategy that brings an element of certainty to the management of pension plans? What if that strategy solved the problem of producing ALL of the necessary liquidity needed to fund monthly benefits and expenses without having to sell securities or sweep cash (dividends and capital distributions) from higher earning products? Wouldn’t it be incredible if in the process of providing the liquidity for some period of time, say 10-years, you’ve now extended the investing horizon for the residual assets not needed in the liquidity bucket? Impossible! Hardly. Cash flow matching does all that and more.

I recently had the privilege of introducing CFM to someone in our industry. The individual was incredibly curious and asked many questions. Upon receiving my replies, they instinctively said “why isn’t everyone using this”? That person then said you aren’t selling a product: it is a SERVICE. How insightful. Yes, unlike most investment strategies that are sold to fill a gap in a traditional asset allocation in pursuit of the “Holy Grail” (ROA), CFM is solving many serious issues for the plan sponsor: liquidity and certainty being just two.

Substituting one small cap manager for another, or shifting 3% from one asset class or strategy to another is not going to make a meaningful impact on that pension plan. You get the beta of that asset class plus or minus some alpha. None of these actions solve the problem of providing the necessary liquidity, with certainty, when needed. None of them are creating a longer investing horizon for the residual assets to just grow and grow. None of those products are supporting the primary pension objective which is to SECURE the promised benefits at low cost and with prudent risk.

So, Ryan ALM, Inc. is providing a critical service in support of our mission which is to protect and preserve your DB pension plan. Why aren’t you and others (everyone) taking advantage of this unique service?

Milliman: Corporate Pension Funding Soars

By: Russ Kamp, CEO, Ryan ALM, Inc.

Milliman has once again released its monthly Milliman 100 Pension Funding Index (PFI), which analyzes the 100 largest U.S. corporate pension plans, and the news continues to be quite good.

Market appreciation of 1.05% during January lifted the market value of PFI plan assets by $8 billion increasing total AUM to $1.327 trillion. A slight 1 bp rise in the discount rate to 5.47% lowered plan liabilities marginally to $1.217 trillion at the end of January. As a result, the PFI funded ratio climbed from 108.2% at the beginning of the year to 109.0% as of January 31, 2026. 

“January’s strong returns contributed $8 billion to the PFI plans’ funding surplus, while declining liabilities contributed another $2 billion,” said Zorast Wadia, author of the Milliman 100 PFI. “Although funded ratios have now improved for 10 straight months, managing this surplus will continue to be a central theme for many plan sponsors as they employ asset-liability matching strategies going forward.” We couldn’t agree more, Zorast! Given significant uncertainty regarding the economy, inflation, interest rates, and geopolitical events, now is the time to modify plan asset allocations by reducing risk through a cash flow matching strategy (CFM).

CFM will secure the promised benefits, provide the necessary monthly liquidity, extend the investing horizon for the non-CFM assets, while stabilizing the funded status and contribution expenses. Corporate plan sponsors have worked diligently tom improve funding and markets have cooperated in this effort. Now is not the time to “let it ride”. Ryan ALM will provide a free analysis to any plan sponsor that would like to see how CFM can help them accomplish all that I mentioned above. Don’t be shy!

Click on the link below for a look at Milliman’s January funding report.

View this month’s complete Pension Funding Index.

For more on Ryan ALM, Inc.

ARPA Update as of February 6, 2026

By: Russ Kamp, CEO, Ryan ALM, Inc.

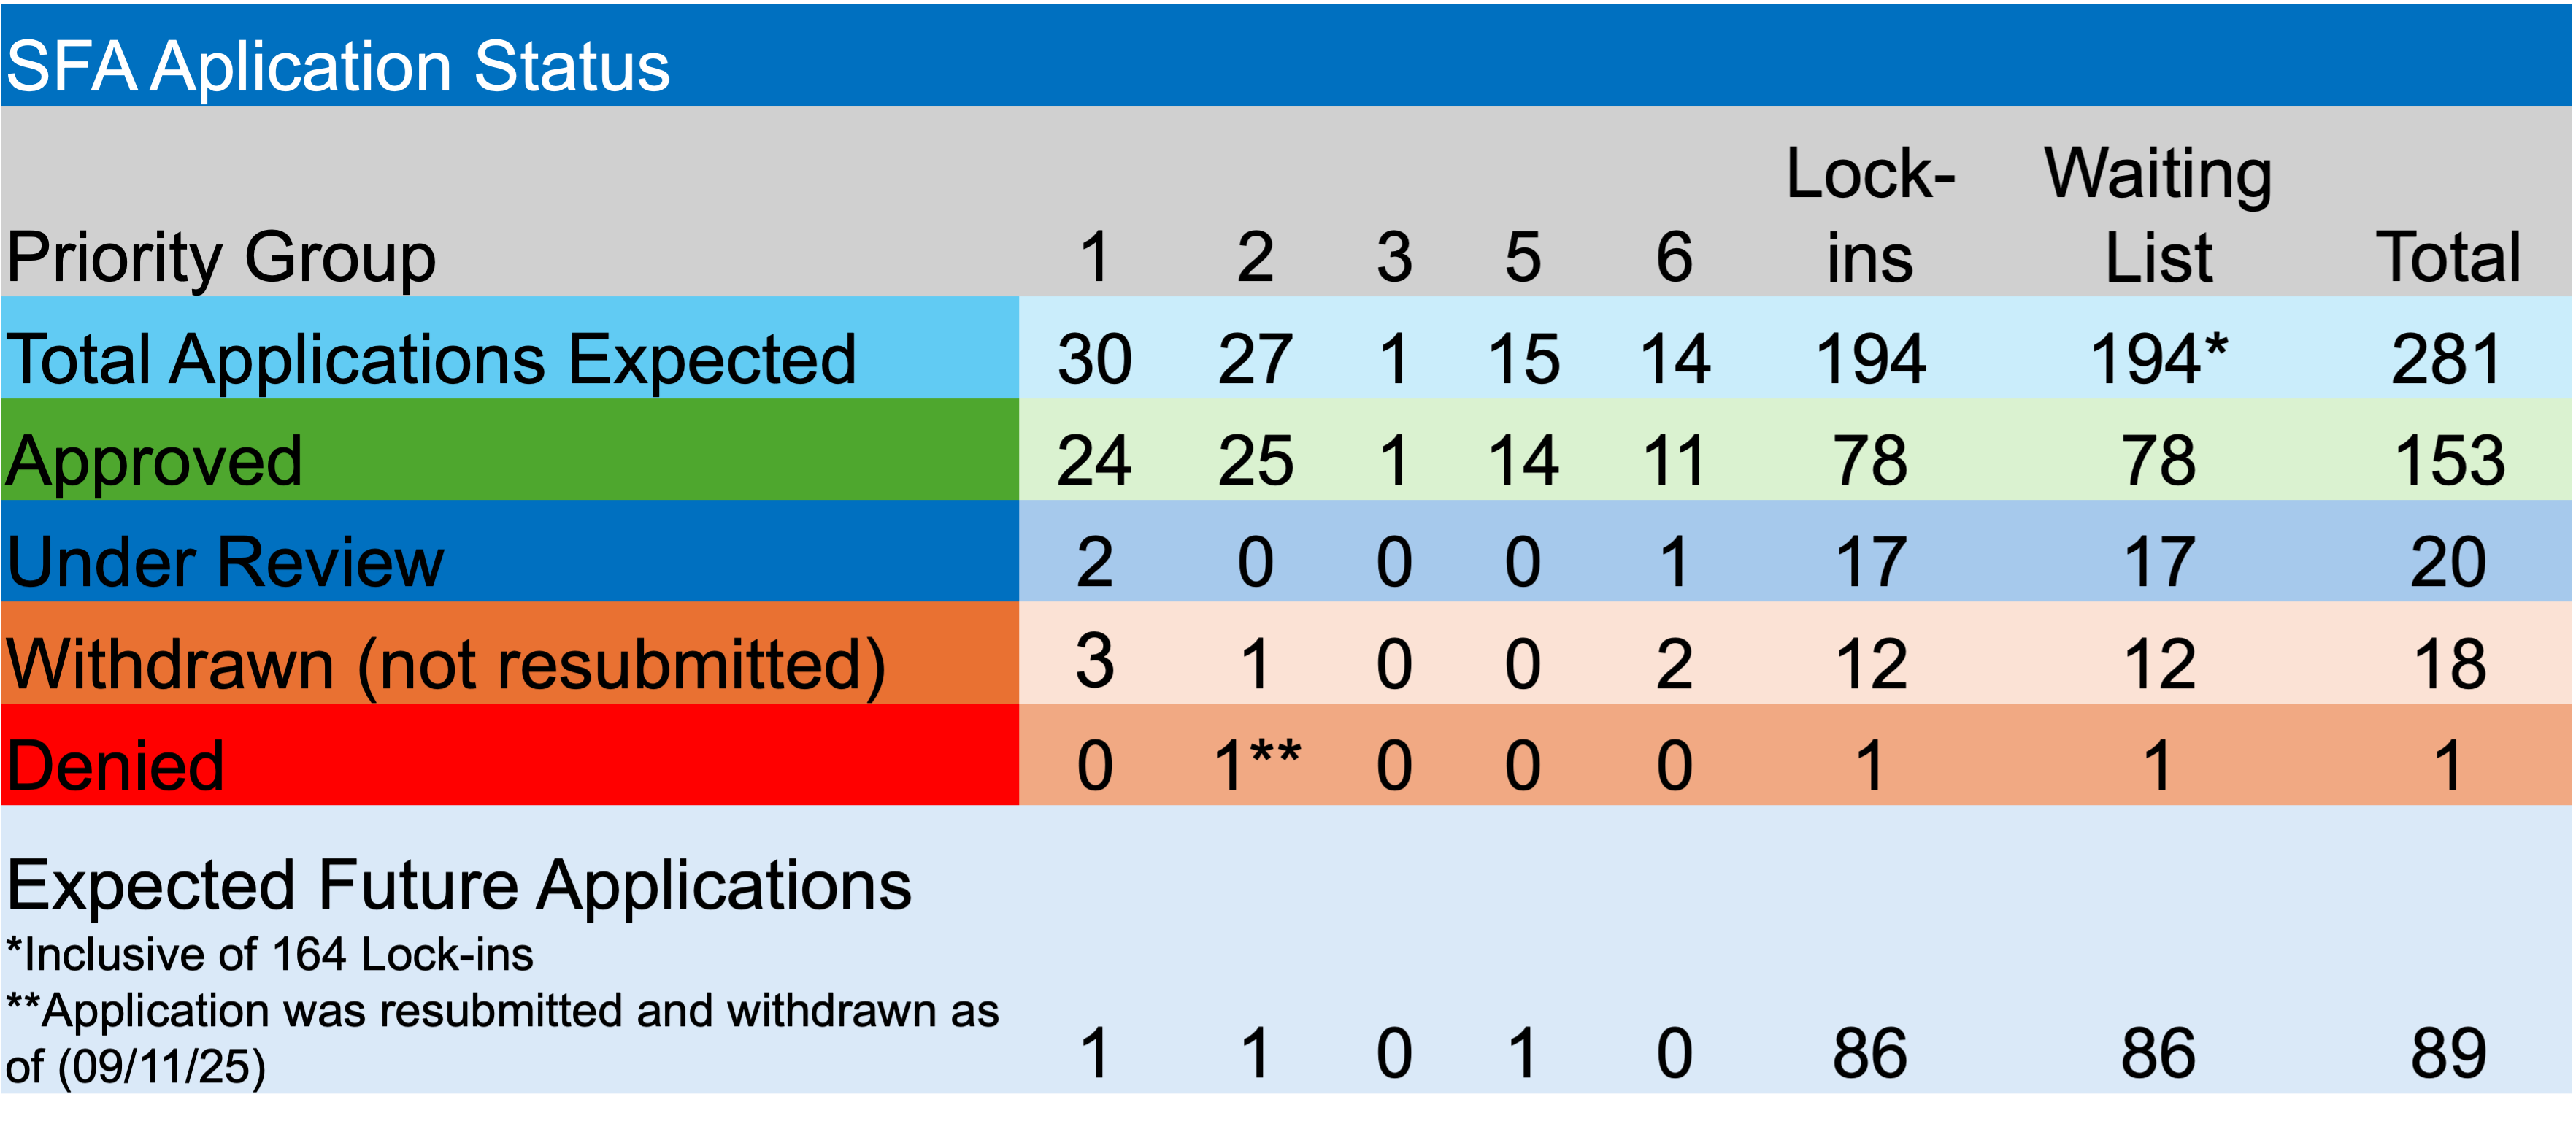
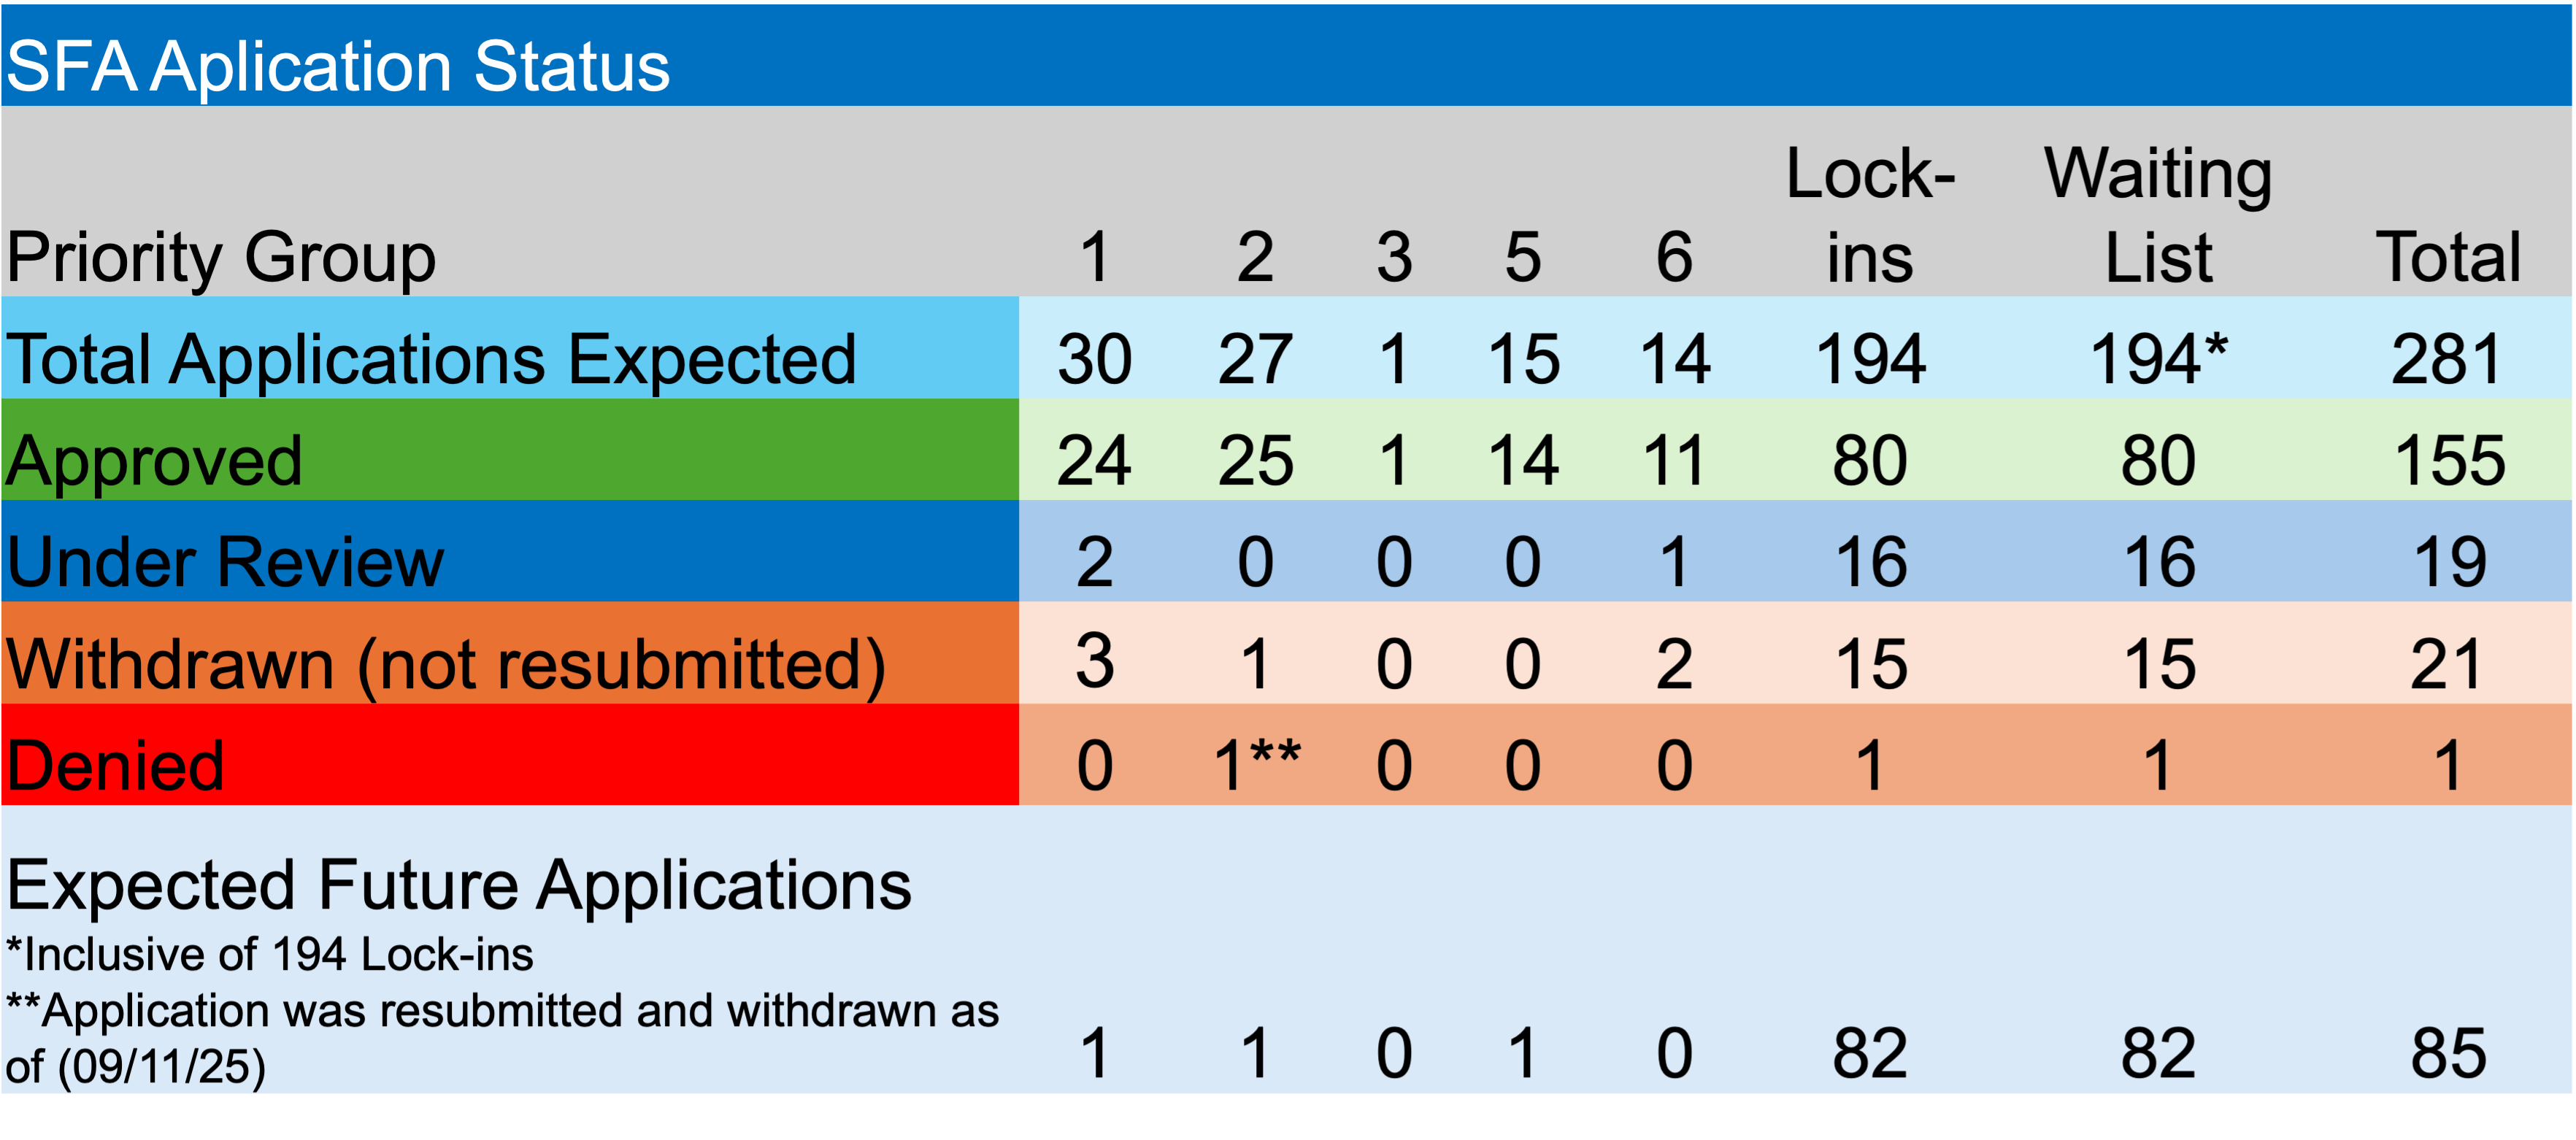
It looks like those of us in the Northeast will finally get some respite from the bitter cold, as temps will moderate this week and actually hit the 30s. However, those multiemployer pension plans currently sitting on the waitlist and classified as a Plan Terminated by Mass Withdrawal before 2020 Plan Year, continue to be frozen in place. According to the PBGC’s latest update, there are 80 plans that fall under the Mass Withdrawal classification. I’ll share more info on this subject later in this post.

Regarding last week’s activity, the PBGC is reporting that one fund, Operative Plasterers & Cement Masons Local No. 109 Pension Plan, a Troy, MI, construction union, will receive $13.7 million for the 1,439 plan members. In addition to the one approval, there was another fund that withdrew its initial application. Norfolk, VA-based International Association of Bridge, Structural, Ornamental and Reinforcing Ironworkers Local No. 79 Pension Fund was seeking $14.6 million in SFA for 462 participants in the plan.

There were no applications submitted for review. It appears that only one non-mass withdrawal plan, Plasterers Local 79 Pension Plan, remains on the waitlist. Fortunately, there were no plans asked to rebate a portion of the SFA grant due to census errors or any funds deemed no eligible.

Regarding the 80 mass withdrawal funds currently sitting on the waitlist, MEPs terminated by mass withdrawal under ERISA §4041A(a)(2) are explicitly ineligible for SFA under ARP/IRA rules, regardless of application timing. Furthermore:

No “initial application” option exists post-termination date.

Mass withdrawal means that all/substantially all employers completely withdraw leading to a plan termination.

PBGC SFA statute excludes §4041A(a)(2) terminated plans.

For the 80 funds sitting on the waitlist, it seems like a long shot that the APRA legislation will be amended to accommodate these funds seeking SFA. I’ll continue to monitor this situation in future posts.

How Do You Know?

By: Russ Kamp, CEO, Ryan ALM, Inc.

I’m on my way home from another terrific FPPTA conference. The only issue I have is with the weather Gods. How is it that Orlando had weather similar to what New Jersey experiences during January? Yes, I was in a conference room from dawn to dusk, but it still wasn’t fair, especially since temps are set to hit 70+ today, while I’m now sitting at the airport. 

Okay, enough of my complaining. As mentioned, I just attended FPPTA’s Winter Trustee meeting in Orlando. They continue to do an excellent job providing critical education for trustees of all experience levels. As I’ve written, they have also developed a higher-level program for a select group of pension trustees that truly want to roll up their sleeves and like Dorothy and her friends, get behind the curtain. I’ve been fortunate to be a part of the first two TLC classes. As the FPPTA continues to develop their use of AI and the self-contained bot currently under construction, Florida public pension trustees will have critical information at their fingertips that few other states, if any, can provide. Great job!

Despite the robust curriculum, there is still much more that needs to be covered and comprehended by the trustees. For instance, there was a lot of discussion surrounding hiring and firing of managers during a particular case study. As I’ve observed over the years, the fortunate investment manager that gets hired usually has the best performance and a reasonable fee that doesn’t offset the performance advantage. Do pension trustees truly understand what they are buying? Often the manager selected is large and likely growing in terms of AUM. But are those advantages?

Worse, when a manager underperforms, which they will eventually do, whether that underperformance is related to a style rotation or something specific to that manager’s process, a decision must be made as to that manager’s fate. Do you keep the manager or let them go? On what basis are you making that decision? Again, you hired a manager because they had good performance. Did you understand their security selection process (insights) and how those insights were working? Did recent strong AUM growth fuel a positive response in the stocks that they owned? As we know, cycles in the investment industry are driven by cash flows, both positive and negative. More money chasing a few ideas drives up returns, while an exodus from those same ideas can tank an investment manager’s performance.

During one exchange of ideas, I asked the TLC participants if any of their funds were using performance fees for their long-only assignments. Only one trustee said that they had – too bad. We’ll discuss that issue in another post. Regarding the one affirmative response, they initiated a performance fee after an extended period of underperformance. Was that action correct? Paying asset-based fees with no promise of delivery on forecasted alpha is wrong, but retaining an underperforming manager may be just as bad whether they are on a performance fee or not. How did this trustee and his fellow board members know whether the manager had skill or if they once did, were their insights still robust?

Investment managers choose their portfolio holdings based on certain insights, and those insights can be measured as to their predictive ability (information coefficient or IC). An information coefficient is the correlation between predicted returns (or rankings of one stock versus another) and the subsequent results (realized returns). If an advisor is a growth manager, they likely swim in a subset of the U.S. equity universe. They then apply their insights to that subset of equity stocks. Each month they can array their portfolio holdings with the balance of the names in the universe that they did not select to see how their ideas stacked up.

You might be surprised to read that a monthly IC above 0.05% is considered fairly strong. An IC from 0.05% to 0.15% would be very strong and likely lead to consistent alpha generation. However, even the best investment ideas can go through challenging times when market dynamics are just out of whack with historic observations and relationships. But there are also times when ideas can get arbitraged away either by that managers growth or the broader investment community latching onto the same insight rendering it less effective or in some cases a negative forecaster/predictor.

So, I ask, when your manager is underperforming, do you know whether it is a market dynamic that is rendering the insight temporarily weak or has that manager’s forecasting ability been diminished? In the case of the manager who maintains strong forecasting ability, but the insight is just out of favor, you would likely want to retain them after a period of underperformance and maybe give them more assets to manage, but I would not recommend putting them on a performance fee (regression to the mean tendencies). However, if after your careful analysis you identify that the manager in question has seen their insights arbitraged away, that should lead you to terminate the manager, whether you like them or not! Let me know if you’d like to discuss his concept in greater detail.

“Everybody’s looking under every rock.” Jay Kloepfer

By: Russ Kamp, CEO, Ryan ALM, Inc.

Institutional Investor’s James Comtois has recently published an article that quoted several industry members on the near-term (10-years) return forecast for both public and private markets, which according to those asked are looking anemic. No one should be surprised by these forecasts given the incredible strength of public markets during the past three years and the fact that regression to the mean tendencies is not just theory.

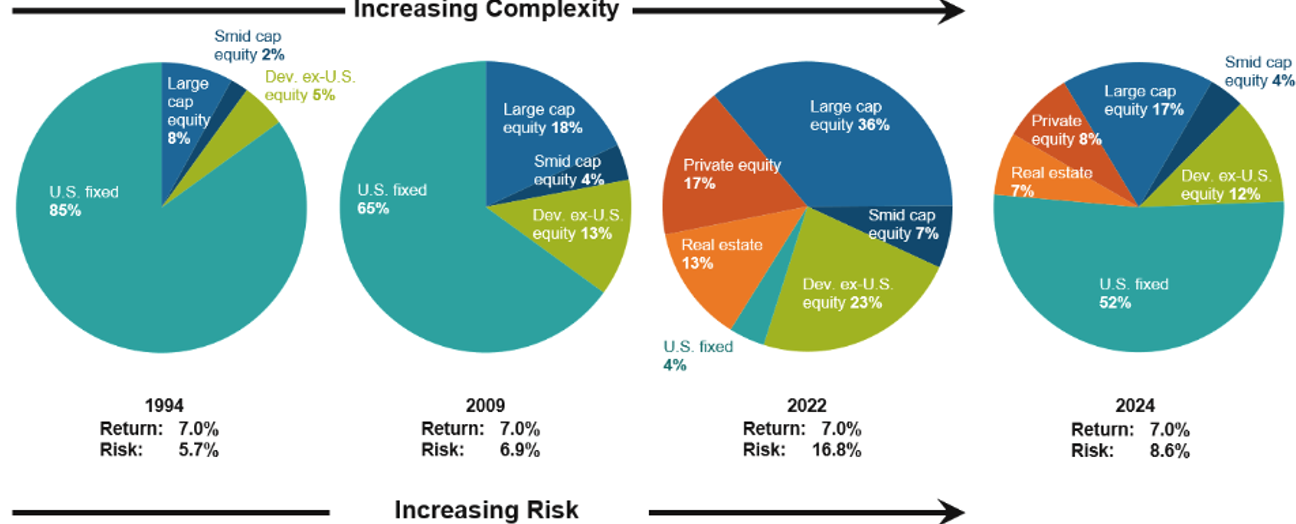
An equally, if not greater, challenge is liquidity. As the title above highlights, Jay Kloepfer, Director of Capital Markets Research at Callan, told II that “Liquidity has become a bigger issue,” He went on to say that “Everybody’s looking under every rock.” Not surprising! Given the migration of assets from public markets to private during the last few decades. The rapid decline in U.S. interest rates certainly contributed to this asset movement, but expectations for “outsized” gains from alternatives also fueled enthusiasm and action. The Callan chart below highlights just how far pension plans have migrated.

I’ve written a lot on the subject of liquidity. Of course, the only reason that pension plans exist is to fund a promise that was made to the participants of that fund. Those promises are paid in monthly installments. Not having the necessary liquidity can create significant unintended consequences. No one wants to be a forced seller in a liquidity challenged market. It is critical that pension plans have a liquidity policy in place to deal with this critical issue. Equally important is to have an asset allocation that captures liquidity without having to sell investments.

Cash flow matching (CFM) is such a strategy. It ensures that the necessary liquidity is available each and every month through the careful matching of asset cash flows (interest and principal) with the liability cash flows of benefits and expenses. No forced selling! Furthermore, the use of CFM extends the investing horizon for those growth assets not needed in the CFM program. Those investments can just grow unencumbered. The extended investing horizon also allows the growth assets to wade through choppy markets without the possibility of being sold at less than opportune times.

So, if you are concerned about near-term returns for a variety of assets and with creating the necessary liquidity to meet ongoing pension promises, don’t rely on the status quo approach to asset allocation. Adopt a bifurcated asset allocation that separates plan assets into liquidity and growth buckets. Your plan will be in much better shape to deal with the inevitable market correction.

Another Cockroach!

By: Russ Kamp, CEO, Ryan ALM, Inc.

As most folks were focused on the massive snowstorm that crippled a large swath of the U.S., BlackRock was disclosing another significant loss in one of their private debt funds. In this case, BlackRock TCP Capital, a publicly traded middle-market lending fund, expects to mark down the net value of its assets 19 per cent after a string of troubled loans weighed on results, marking the latest sign of pressure in the private credit market.

BlackRock’s vehicle is a business development company (BDC), which pools together private credit loans and trades like a stock. According to multiple reports, the fund has struggled in part because of its exposure to e-commerce aggregators which are companies that buy and manage Amazon sellers. Furthermore, BDC shares have been hit over the past year. There are currently 156 active BDCs, of which 50 are publicly traded. BDC Investors have concerned over private credit returns, underwriting standards and increased regulatory scrutiny. FINALLY!

Of course, this is not an isolated incident for either private credit/debt in general or specifically BlackRock. As you may recall, BlackRock was forced to reprice a private debt holding from par to zero last November, when Renovo Home Partners, a Dallas-based home-remodeling roll‑up that collapsed into Chapter 7 bankruptcy, triggering a roughly $150 million total loss on a private loan largely held by BlackRock.

Funds managed by BlackRock (notably its TCP Capital Corp. BDC) provided the majority of roughly $150 million in private credit to Renovo, while Apollo’s MidCap Financial and Oaktree held smaller slices. As of late September 2025, lenders were still marking this loan at 100 cents on the dollar, implying expectations of full repayment. This shouldn’t have come as a complete surprise because earlier in 2025, lenders had already agreed to a partial write‑off and debt‑to‑equity swap, trying to stabilize Renovo’s capital structure.​

This unfortunate outcome highlights how “mark‑to‑model” valuations in private credit can keep loans at par until very late, then reprice suddenly when a borrower fails. This practice suggest that headline yields in private credit may understate true default and loss severity risk, especially for highly leveraged sponsor‑backed roll‑ups. Yet, it doesn’t seem to have rattled either the market or institutional asset owners who continue to plow significant assets into this opaque and potentially saturated market. It continues to amaze me the number of “searches” being conducted for private credit/debt. Asset classes can get overwhelmed driving down future returns. Do you know what the natural capacity is for this asset class and the manager(s) that you are hiring? Caveat emptor!

How Does One Secure A Benefit?

By: Russ Kamp, CEO, Ryan ALM, Inc.

We hope that you’ll agree that going to Chicago in January demonstrates the lengths that Ryan ALM personnel will go to help plan sponsors and their advisors protect and preserve DB pension plans. We are just thankful that we left yesterday, as today’s temperature is not expected to get to 0. OUCH!

Ron Ryan and I spent the last couple of days speaking with a number of funds and consultants about the many benefits of cash flow matching (CFM), which is gaining incredible traction among pension sponsors of all types. Who doesn’t want an element of certainty and enhanced liquidity within their plans given all the uncertainty we are facing in markets and geopolitically.

The idea of creating an element of certainty within the management of pension plans sounds wonderful, but how is that actually achieved? This is a question that we often receive and this trip was no exception. We had been discussing the fact that the relationship between asset cash flows (bond principal and interest) and liability cash flows (benefits and expenses) is locked in on the day that the bond portfolio is produced. The optimization process that we created blends the principal and interest from multiple bonds to meet the monthly obligations of benefits and expenses with an emphasis on longer maturity and higher yielding bonds to capture greater cost reduction of those future promises.

However, to demonstrate how one defeases a future liability, my example below highlights the matching of one bond versus one future $2 million 10-year liability. In this example from 18-months ago we purchased:

Bond: MetLife 6.375% due 6/15/34, A- quality, price = $107.64

Buy $1,240,000 par value of MetLife at a cost = $1,334,736

Interest is equal to the par value of bonds ($1,240,000) times the bond’s coupon (6.375%)

As a result of this purchase, we Receive: 

  Interest =  $78,412.50 annually ($39,206.25 semi-annual payments)

                            Total interest earned for 10 years is $784,125

  Principal = $1,240,000 at maturity (par value)

Total Cash Flow = $2,024,125  – $2,000,000 10-year Liability  = $24,124.99 excess

                             ($24,124.99 excess Cash Flow)

Benefits:

Able to fund $2 million benefit at a cost of $1.335 million or a -33.25% cost reduction

Excess cash flow can be reinvested or used to partially fund other benefits

In today’s yield environment, our clients benefit to a greater extent asking us to create longer maturity programs given the steepness of the yield curve. If they don’t have the assets to fund 100% of those longer-term liabilities, we can defease a portion of them through what we call a vertical slice. That slice of liabilities can be any percentage that allows us to cover a period from next month to 30-years from now. In a recent analysis produced for a prospect, we constructed a portfolio of bonds that covered 40% of the pension plan’s liabilities out to 30-years. As a result, we reduced the present value cost to defease those liabilities by –42.7%!!

Reach out to us today to learn how much we can reduce the future value cost of your promised benefits. We do this analysis for free. We encourage you to take us up on our generous offer.

ARPA Update as of January 16, 2026

By: Russ Kamp, CEO, Ryan ALM, Inc.

We hope that the continuing success of the ARPA pension legislation warms your heart despite ridiculously cold temperatures in New Jersey and elsewhere.

Regarding last week’s activity, pleased to report that two plans received approval for their SFA applications. Pension Trust Fund Agreement of St. Louis Motion Picture Machine Operators and Teamsters Local 837 Pension Plan, both non-priority group members, will receive a combined $19.9 million in SFA and interest for their 1,431 members. These approvals are the first for the PBGC in just under one month.

In other ARPA news, there were no new applications filed, as the e-Filing portal remains temporarily closed. In addition, as we’ve been reporting, the window for initial applications to be submitted was to close on 12/31/25. From this point forward, only revised applications should be received by the PBGC. Despite that impediment, two more funds, NMU Great Lakes Pension Fund and UFCW Pension Fund of Northeastern Pennsylvania, added their names to the extensive waitlist seeking Special Financial Assistance. These plans and the others currently on the list must believe that the current deadline in place will be amended.

There was one application withdrawn during the prior week, as the Dairy Employees Union Local #17 Pension Plan pulled their initial application seeking $3.5 million in SFA for the 633 plan participants. Under the current rules, they have until 12/31/26 to resubmit a revised application.

Lastly, there were no applications denied nor were any of the previous recipients of SFA asked to rebate a portion due to census errors.

The U.S. interest rate environment is reacting to some of the global uncertainty. As a result, longer dated Treasury yields are marching higher. As of 9:51 am, the yield on the 30-year Treasury bond is 4.93%, while the 10-year Treasury note yield is at 4.29%. These yields are quite attractive for plans receiving SFA and wanting to secure benefits and expenses with the proceeds. Don’t miss this opportunity to significantly reduce the cost of those future benefits.

Is A “K” Truly Representative?

By: Russ Kamp, CEO, Ryan ALM, Inc.

I recently attended the Opal Public Fund Forum in Arizona. I’ve always appreciated the opportunity to attend and speak at Opal’s pension conferences. This latest version was no exception. However, I found it interesting that there were two thoughts being expressed over and over again. First, many presenters talked about uncertainty. The other idea centered on the current economic environment, which was frequently described as being K-shaped.

Regarding uncertainty, we often write about the onerous impact of uncertainty on individuals, both from a psychological as well as a physiological standpoint. Yet the pension community continues to embrace uncertainty through implementation of traditional asset allocation approaches, which are potentially subject to significant market events. Why? I’m not going to dwell on this topic today as I’d rather focus some attention of the current economic environment, and I’ve covered many times how Ryan ALM can bring certainty, and a sleep-well-at-night approach, to pension management.

As the title above questions, is defining the current economic environment as a K appropriate? When I look at the letter K, it says to me that 50% of something is advancing while another 50% is declining. Is that what is happening in today’s economy? Are 50% of American workers showing strong economic gains, while 50% struggle? I would say, “NO”! No matter what metrics one reviews, indications are that a far greater percentage of the American workforce is struggling to meet basic living needs than a K would suggest. I’m not sure what letter truly represents today’s conditions, but when only 10%-20% of our households are seeing improved conditions that doesn’t conjure up a K in my mind.

The idea of American Exceptionalism is being challenged by today’s economic realities. It is so disappointing given the potential that we possess as a nation. However, our collective wealth continues to be concentrated among a small percentage of American households at the same time that expenses for basic needs – housing, medical coverage, education, childcare, food, insurance, utilities, and retirement – continue to challenge most budgets.

In a recent article by Adam Bonica, titled “The Wall Looks Permanent Until it Falls”, Adam highlights (lowlights perhaps) the significant differences in key metrics relative to a U.S. peer democracy group of 31 developed nations (OECD). For instance, he shows multiple stats in four broad categories, including Economy and Inequality, Family and Livelihood, Survival and Safety, and Institutions and Justice. It is not to say that these peers don’t have these issues – they do. They just experience them at much lower rates. The comparisons that Mr. Bonica focused on were just the averages for the peer group relative to the U.S., and they prove quite stark.

For instance, the peer average for the Top 1% of households by income is 12.8%, while in the U.S. it is 21%! If the Top 1% of earners just took 12.8%, every American household would get an additional $19k/year. If the Top 1% of Household wealth in the U.S. only had 23.2% of the country’s wealth instead of the 30.6% it currently has, every American household would have an additional $96k. A big expenditure every year for American households is healthcare. Our peers average 9.2% of one’s household spending while we average 17.1%. Just matching the rate of spending would reduce our annual expenditure for healthcare by -2.1T/year. Oh, and it isn’t like our “investment” in healthcare is reaping longevity rewards – it isn’t, as we average -4.1 years less than our average peer (78.4 years versus 82.5 years).

We can do a lot better as a society and economy. There are currently 15 million Americans working full-time that earn a level of income that is below the poverty line. Not acceptable. Only about 10% of the American workers are in DB pension plans. As I’ve stated many times, asking untrained individuals to fund, manage, and then disburse a “benefit” without disposable income, no investment acumen, and no crystal ball to help with longevity is just poor policy. Again, we can do better. Ron and I and the Ryan ALM team are focused on protecting and preserving DB pension plans. I wish that we could do more!