Unfortunately, the Joke Was On Us!

By: Russ Kamp, CEO, Ryan ALM, Inc.

I started raising alarm bells related to DB pension exposure to alternatives – mainly private equity and private credit several years ago, and have produced roughly a dozen blog posts that touch on this issue. You may recall some of the posts from 2024:

The Joke’s On Us!

Good Ideas are Often Overwhelmed!

Kinda Silly Question

Well, unfortunately it appears that it is time to pay the piper! As mentioned in the posts listed above, we as an industry don’t truly appreciate the idea that there is a natural capacity to EVERY investment. As an industry, we DO overwhelm good ideas and those funds that are late to the party are often left with just the crumbs in the chaffing dish.

I stumbled over a good, but scary, list of recent events within private credit. The list was compiled by Ignacio Ramirez Moreno, Host of The Blunt Dollar Podcast:

Cliffwater saw 14% redemption requests.

Morgan Stanley’s fund got 10.9%.

Blackstone hit a record 7.9%.

All three capped withdrawals below what investors requested.

Glendon Capital flagged concerns about Blue Owl’s valuations.

Pimco called it “a crisis of really bad underwriting.”

JPMorgan’s marking down loans and tightening lending to private credit funds.

Partners Group thinks defaults could double.

Pimco’s predicting a “full-blown default cycle.”

Apollo’s saying the pain could last 12-18 months.

Well, that is some list! In addition, I was always quite skeptical of the credit quality that was assigned to these companies, and I guess that I wasn’t too far off given that 43% of private credit borrowers have negative free cash flow. Furthermore, the U.S./Israel vs. Iran war won’t help either, as inflation expectations have ratcheted higher reducing significantly the prospects for Fed action leading to lower rates. In fact, it would not be surprising to see the Fed have to raise rates. If such an action occurs, the higher interest rates could exacerbate the current challenging environment for private debt borrowers and their income statements.

Let’s see how the pension plan sponsor community and their advisors deal with private credit’s first real crisis. It should be both interesting and likely painful.

ARPA Updated as of March 13, 2026

By: Russ Kamp, CEO, Ryan ALM, Inc.

I’ll be wearing my green tomorrow. How about you? Perhaps the luck of the Irish will carry some weight with the PBGC during the upcoming week, but it didn’t have much sway last week.

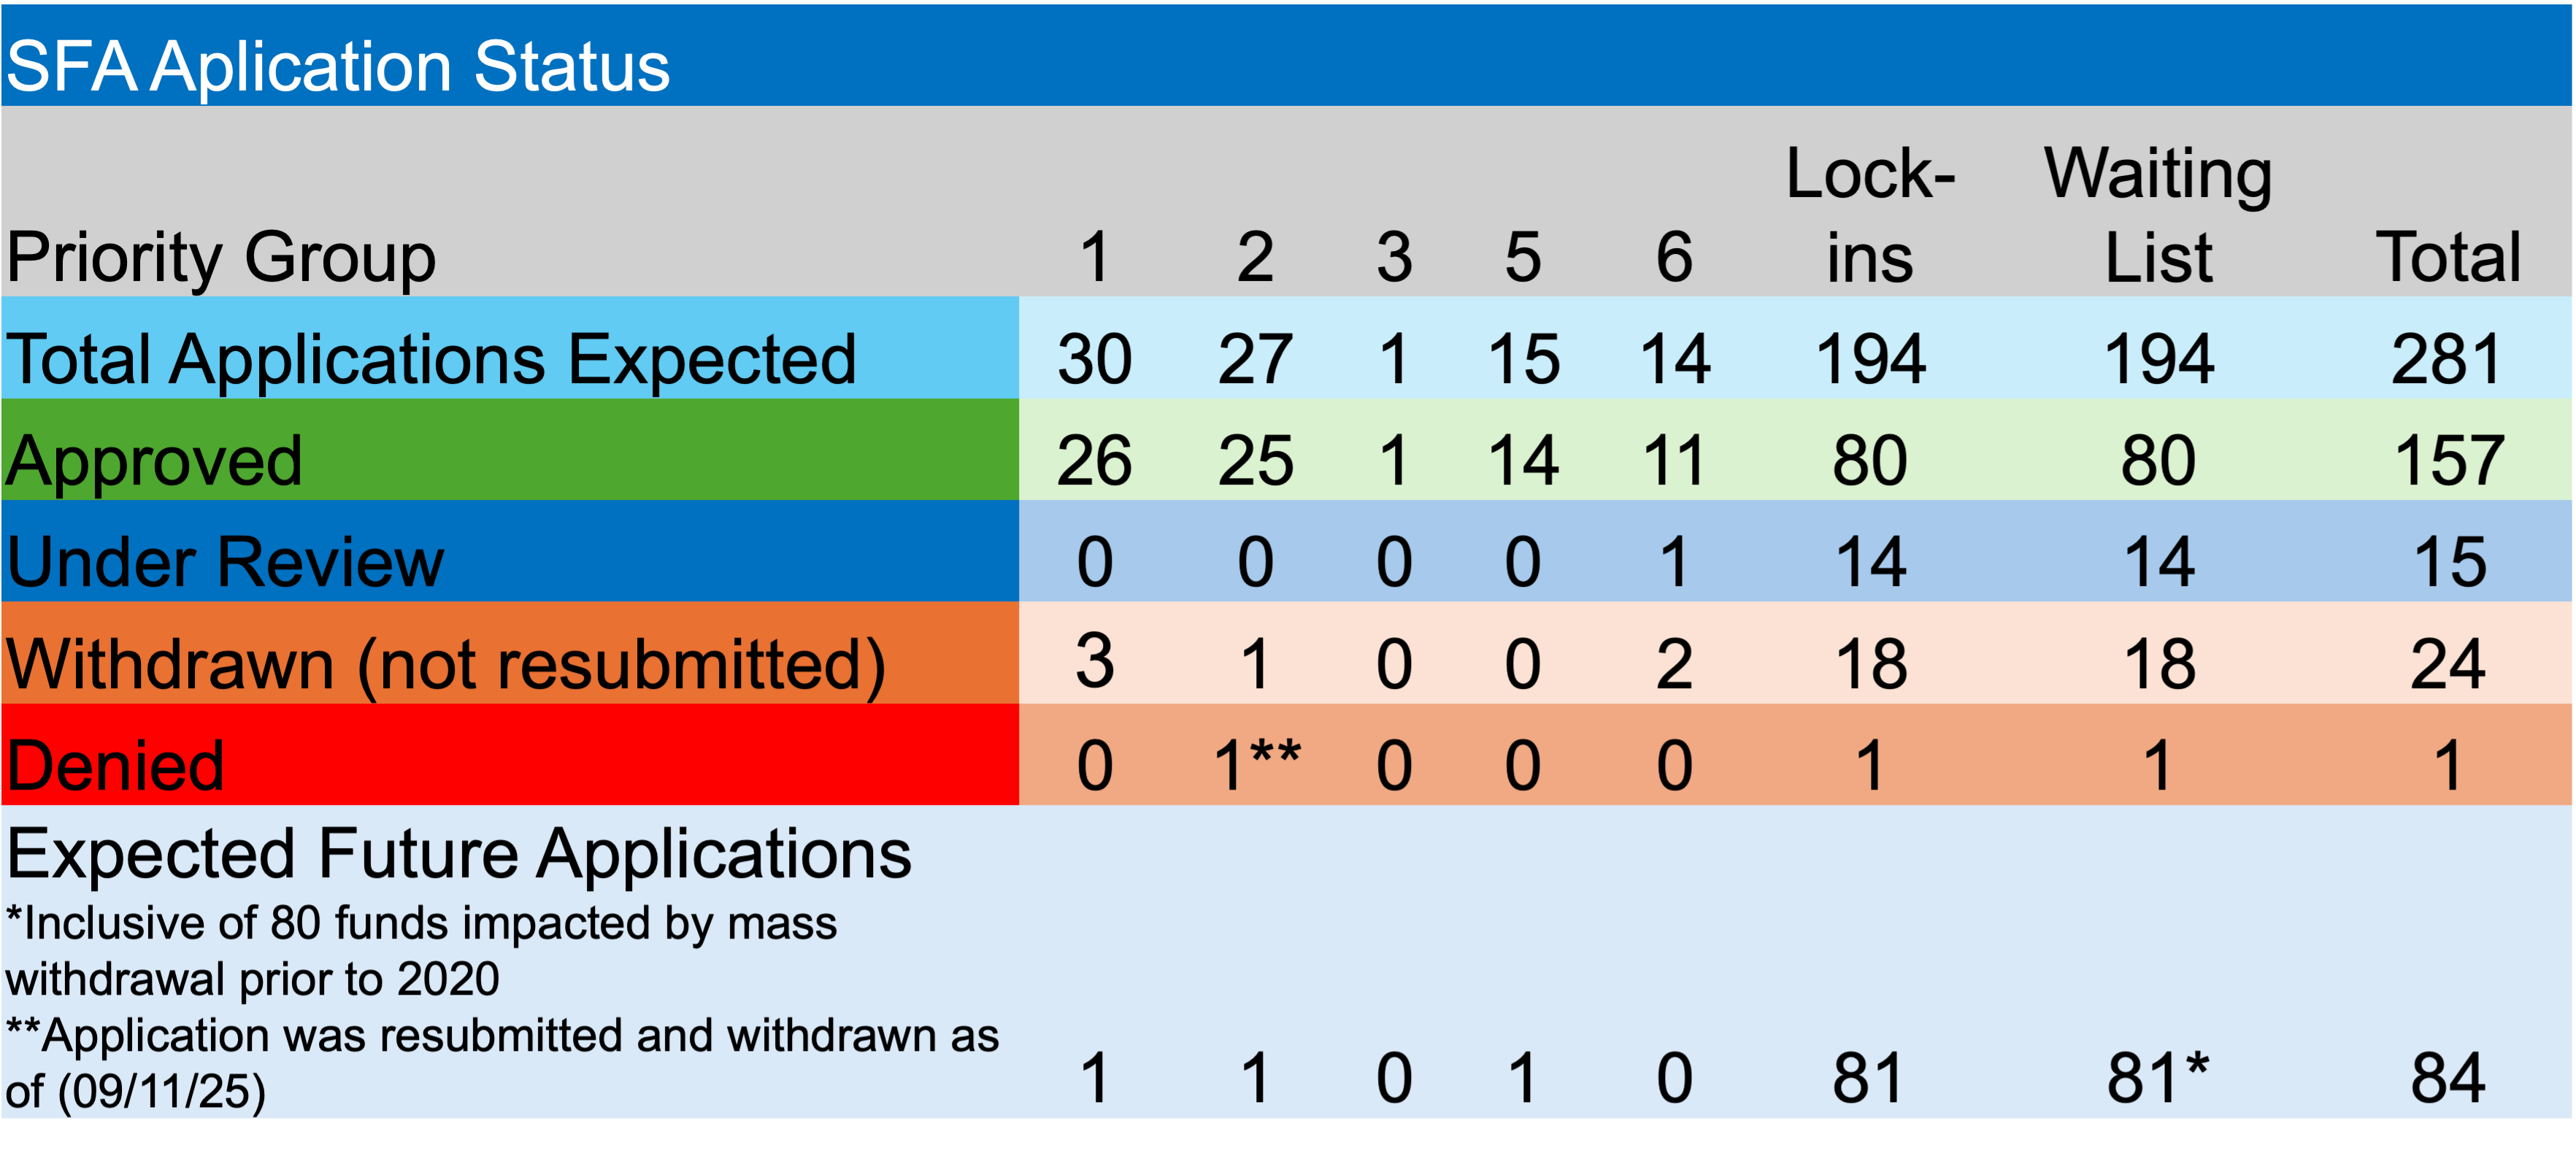
The PBGC accepted two revised applications for Special Financial Assistance (SFA) for the week ending March 13th. Iron Workers Local No. 12 Pension Fund and the Iron Workers-Laborers Pension Plan of Cumberland, Maryland submitted revised applications. Together they are seeking a modest $24.2 million for their 1,413 plan participants. The PBGC will have 120-days to act on the applications.

According to the PBGC’s website, their e-Filing Portal remains temporarily closed. As discussed previously, there is one fund currently on the waitlist that hasn’t submitted an initial application that is not classified as a Plan Terminated by Mass Withdrawal before 2020 Plan Year.

In other ARPA news, there were no applications approved or denied in the past week, and none withdrawn. The PBGC currently has 15 applications under review, including nine that are an initial application. Fortunately, it seems as if any SFA recipient that might have had to repay a portion of the grant due to census issues has done so at this point. There have been no payments of excess funds since last September.

There has not yet been a public, plan‑by‑plan PBGC resolution of the mass‑withdrawal‑terminated plans on the SFA waitlist. As previously mentioned, the legal landscape has changed (2025) which puts pressure on the PBGC oversight. What changed from the original interpretation of “eligible plans” was the Second Circuit’s decision held that the SFA statute does not exclude multiemployer plans that had previously terminated by mass withdrawal, reversing PBGC’s denial of SFA to a fund that terminated in 2016. Furthermore, the court read ARPA’s “critical and declining” language to focus on status in the 2020–2022 window, and rejected PBGC’s position that lack of ongoing “zone status” or prior termination automatically barred eligibility.

As a result, the PBGC’s Office of Inspector General (OIG) issued a 2025 risk advisory flagging that the appellate decision opens the door for 123 terminated plans to seek SFA (80 currently on the waitlist), 91 of which are terminated and insolvent and 32 that are terminated but not yet insolvent and have not received traditional financial assistance.​ The OIG estimates that if SFA is ultimately provided to that group, gross SFA exposure could be on the order of billions of dollars. But, just think about the American Workers that might eventually recoup their promised benefits.

What is the PCE Price Index Telling Us?

By: Russ Kamp, CEO, Ryan ALM, Inc.

As most investors know, the Federal Reserve’s primary inflation measure is the Core Personal Consumption Expenditures (PCE) price index. The Federal Open Market Committee (FOMC) targets 2% annual PCE inflation while trying to balance long-term price stability and maximum employment. The PCE is produced by the Department of Commerce. Why the PCE? The PCE inflation index covers broad household spending and importantly it adjusts for shifts in consumer behavior, unlike fixed-basket indexes, such as the Consumer Price Index (CPI). Furthermore, the PCE reflects actual expenditures economy-wide and updates the index weights more dynamically. The goal of the PCE inflation measure is to help gauge underlying trends in the broader economy.

The most recent PCE inflation data was published as of today, March 13, 2026, covering a period through January 2026. Core PCE (excluding food and energy) ticked up to 3.06% in January 2026, after having touched 3% at year-end. Cleary, this reading remains well above the Fed’s 2% target, reflecting persistent underlying pressures that may become even more dramatic with the 41% increase per barrel of WTI registered since the close on Friday, February 27th.

The PCE inflation measure has recently accelerated while CPI cooled primarily due to differences in housing weights (lower in PCE) and consumer behavior adjustments.

MonthHeadline PCE (%)Core PCE (%)Headline CPI (%)Core CPI (%)
Dec 20252.93.02.72.9
Jan 20262.93.12.42.5
Feb 2026 (est)??2.4?

The fact that core PCE has now exceeded 3% must be worrying for the FOMC/FED that are also dealing with broader economic pressures, such as employment and US interest rates. Speaking of rates, historically the U.S. 10-year Treasury note has traded at a premium yield to inflation of roughly 2%, with periods as high as 3% or greater. The 10-year Treasury note is currently trading at a yield of 4.25% (as of 10:29 am) suggesting that a “normal” spread should have the YTM at 5.1%.

Given the great uncertainty related to current economic and geopolitical issues, it would not be surprising to see the Treasury yield curve continue to shift upwards. Such a move would create a wonderful environment for pension plan sponsors to de-risk through a cash flow matching (CFM) strategy. It is time to bring an element of certainty to the management of DB pensions to reside in a state of great uncertainty! Don’t wait to explore the amazing benefits provided by CFM.

It’s Not Just the Price of Gasoline!

By: Russ Kamp, CEO, Ryan ALM, Inc.

Folks (the investment community) seem to be focused on the rising price of oil for its effect on gasoline prices, but the impact of rising oil prices has far greater implications for the broader U.S. economy. Evidence indicates that a vast majority of manufactured goods and industrial processes use petroleum products that are feedstocks to make plastics, synthetic fibers, solvents, and many chemicals, which then become inputs into consumer goods, packaging, vehicles, electronics, building materials, and more.

Because plastics, synthetic fibers, and petrochemical-derived materials pervade sectors from automotive to consumer goods to packaging, a large majority of U.S. manufactured products (“most”) depend on oil products somewhere in their supply chain, either as material or as critical process input.

An extended increase in the price oil could have a dramatic impact on inflation, U.S. interest rates, the labor force, and overall economic activity. Have pension plans done enough to secure the necessary liquidity to meet the promised benefits and the expenses incurred to meet those monthly payments? Has the significant migration of pension assets to alternatives significantly reduced the available liquidity? Do plans understand that in crisis most asset classes tend to find correlations closer to 1 than 0, making the forced sale of assets to meet benefits challenging and more expensive.

Dividing a pension plans asset allocation into two buckets – liquidity and growth – as opposed to having the plan’s assets focused on the return on asset (ROA) assumption can mitigate liquidity risk. Use a cash flow matching (CFM) strategy to ensure that the necessary liquidity (asset cash flows of interest and maturing principal from bonds) is available to meet the liability cash flows of benefits and expenses monthly. While the CFM strategy is SECURING the promised benefits, the remainder of the assets can just grow unencumbered – no forced selling.

Who knows how long this conflict in the Middle East will last. Pension plans may be “long-term” investors, but they have short-term cash needs that must be met. There is no kicking the can down the road. Adopt this bi-furcated asset allocation and enjoy the benefits that come from the knowledge that your promises have been secured.

Milliman: Corporate Pension Funding now at 109.4%

By: Russ Kamp, CEO, Ryan ALM, Inc.

Milliman has released the latest monthly report on the Milliman 100 Pension Funding Index (PFI). As a reminder, this index analyzes the 100 largest U.S. corporate pension plans.

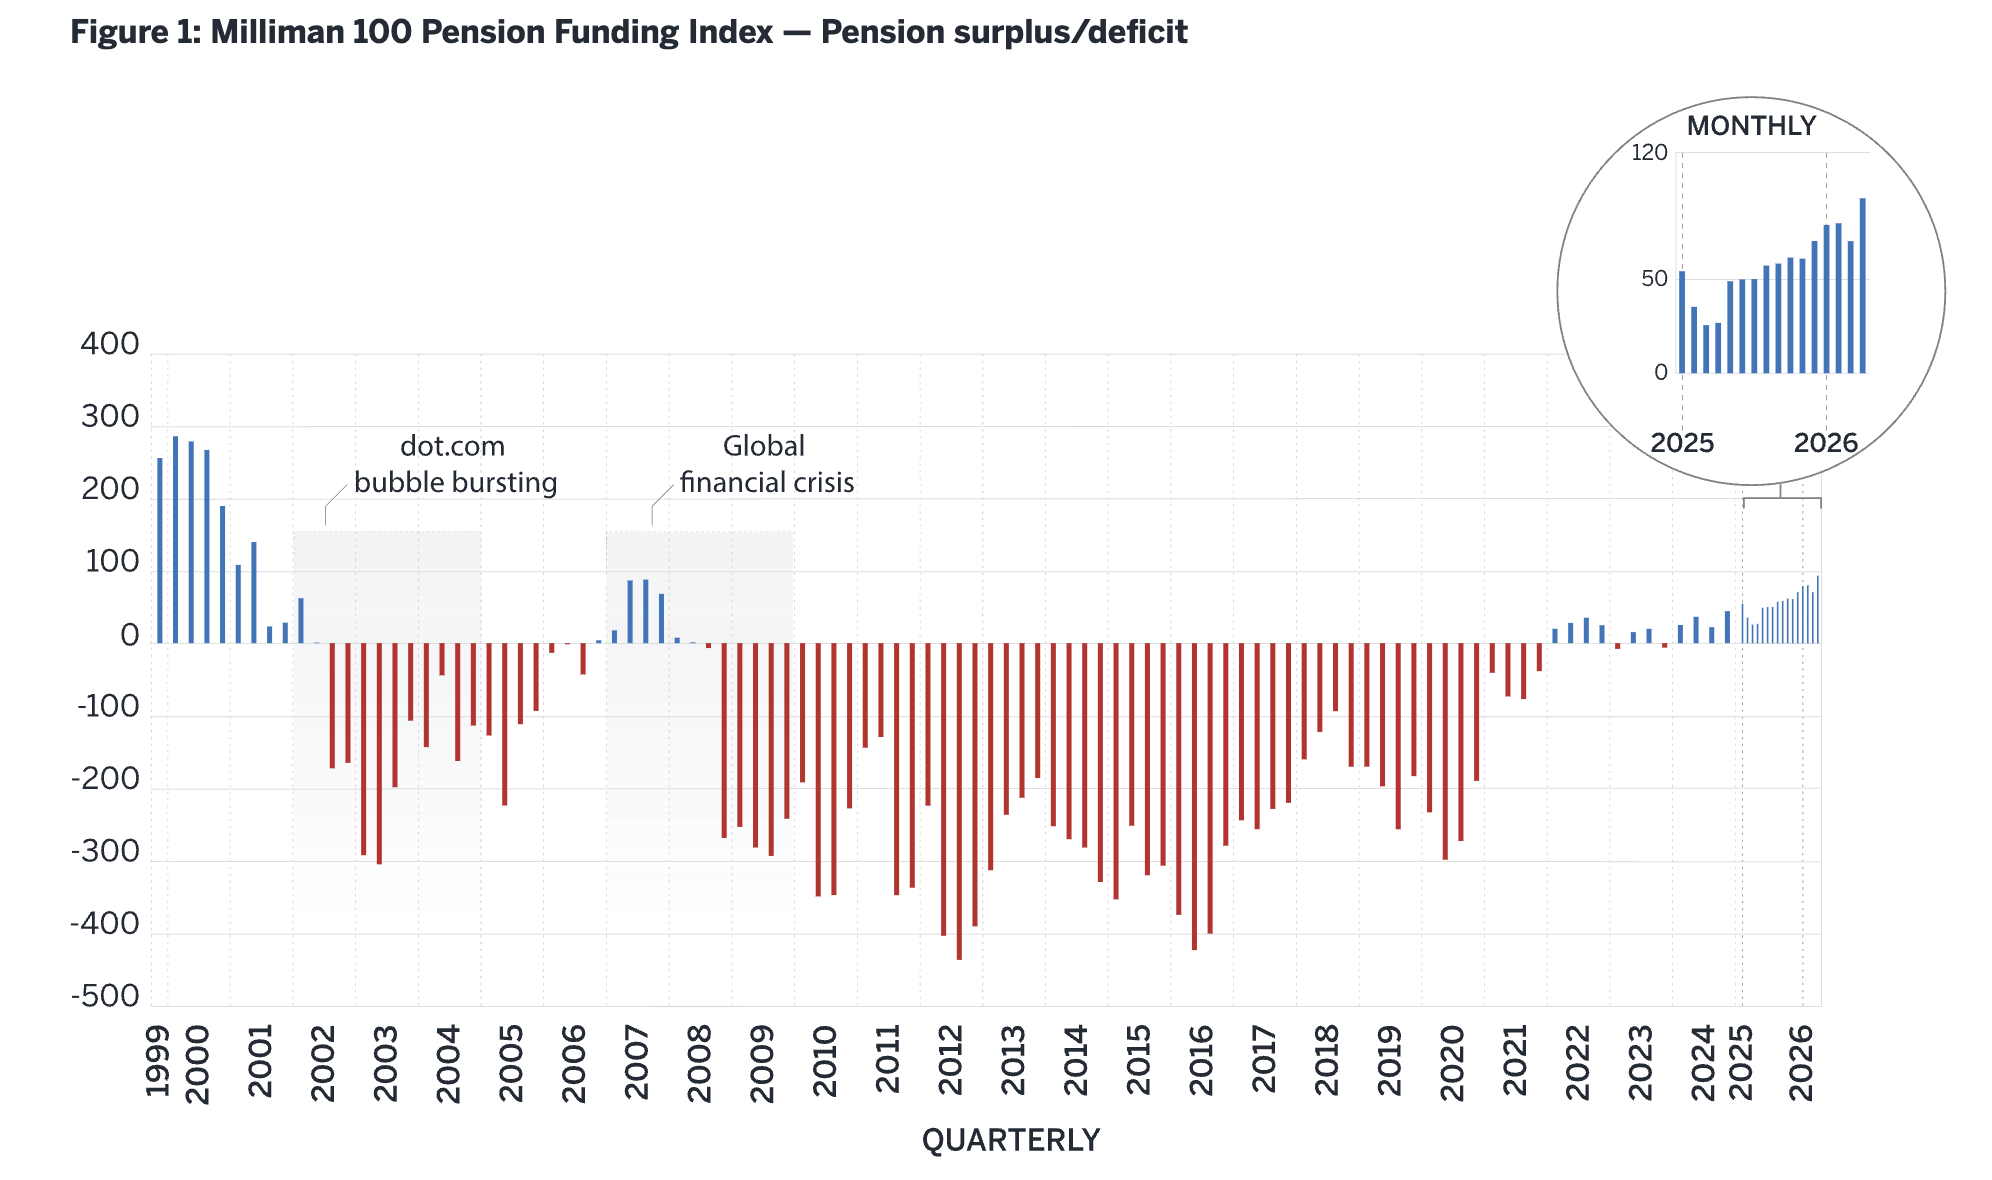
For February, the PFI funded ratio rose from 109.1% as of January 31, to 109.4% as of February 28, marking the highest collective funded ratio since the 109.9% mark observed in July 2001. However, the funding improvement was solely a result of asset performance, as declining discount rates of 14 basis points reduced the discount rate to 5.33% and raised the PFI projected benefit obligation (liabilities) to $1.235 trillion. Fortunately, monthly returns of 2.15% offset the impact of falling U.S. interest rates leading to growth in the market value of plan assets by $22 billion, to $1.351 trillion.

“February’s investment performance drove the month’s $5 billion gain in funding levels,” said Zorast Wadia, author of the Milliman PFI. He went on to say that “while this marks 11 straight months of funding improvements, further declines in interest rates may occur, and ongoing market volatility makes it vital for plan sponsors to undertake surplus-management strategies focused on both sides of the balance sheet.” We continue to support Zorast in recommending that managing assets to liabilities is critical for DB pension plans in all market environments, but especially given the significant uncertainty under which markets are currently operating. As a reminder, the primary objective in managing a DB pension is to SECURE the promised benefits at a reasonable cost and with prudent risk. It is NOT a return objective.

We, at Ryan ALM, do not forecast interest rates, but the impact of rising oil prices (WTI currently up 30.7% as of 9:13 am EST since Friday) will likely have an impact on inflation and interest rates. It will be interesting to see if a potential fall in the value of liabilities proves greater than the potential impact that rising rates might have on equity markets and other assets. Will we see the 12th consecutive month of improved funding levels?

Please click on the link below for a look at the complete Milliman corporate pension funding report.

View this month’s complete Pension Funding Index.

ARPA Update as of February 27, 2026

By: Russ Kamp, CEO, Ryan ALM, Inc.

Welcome to March and all the “madness” that comes with it!

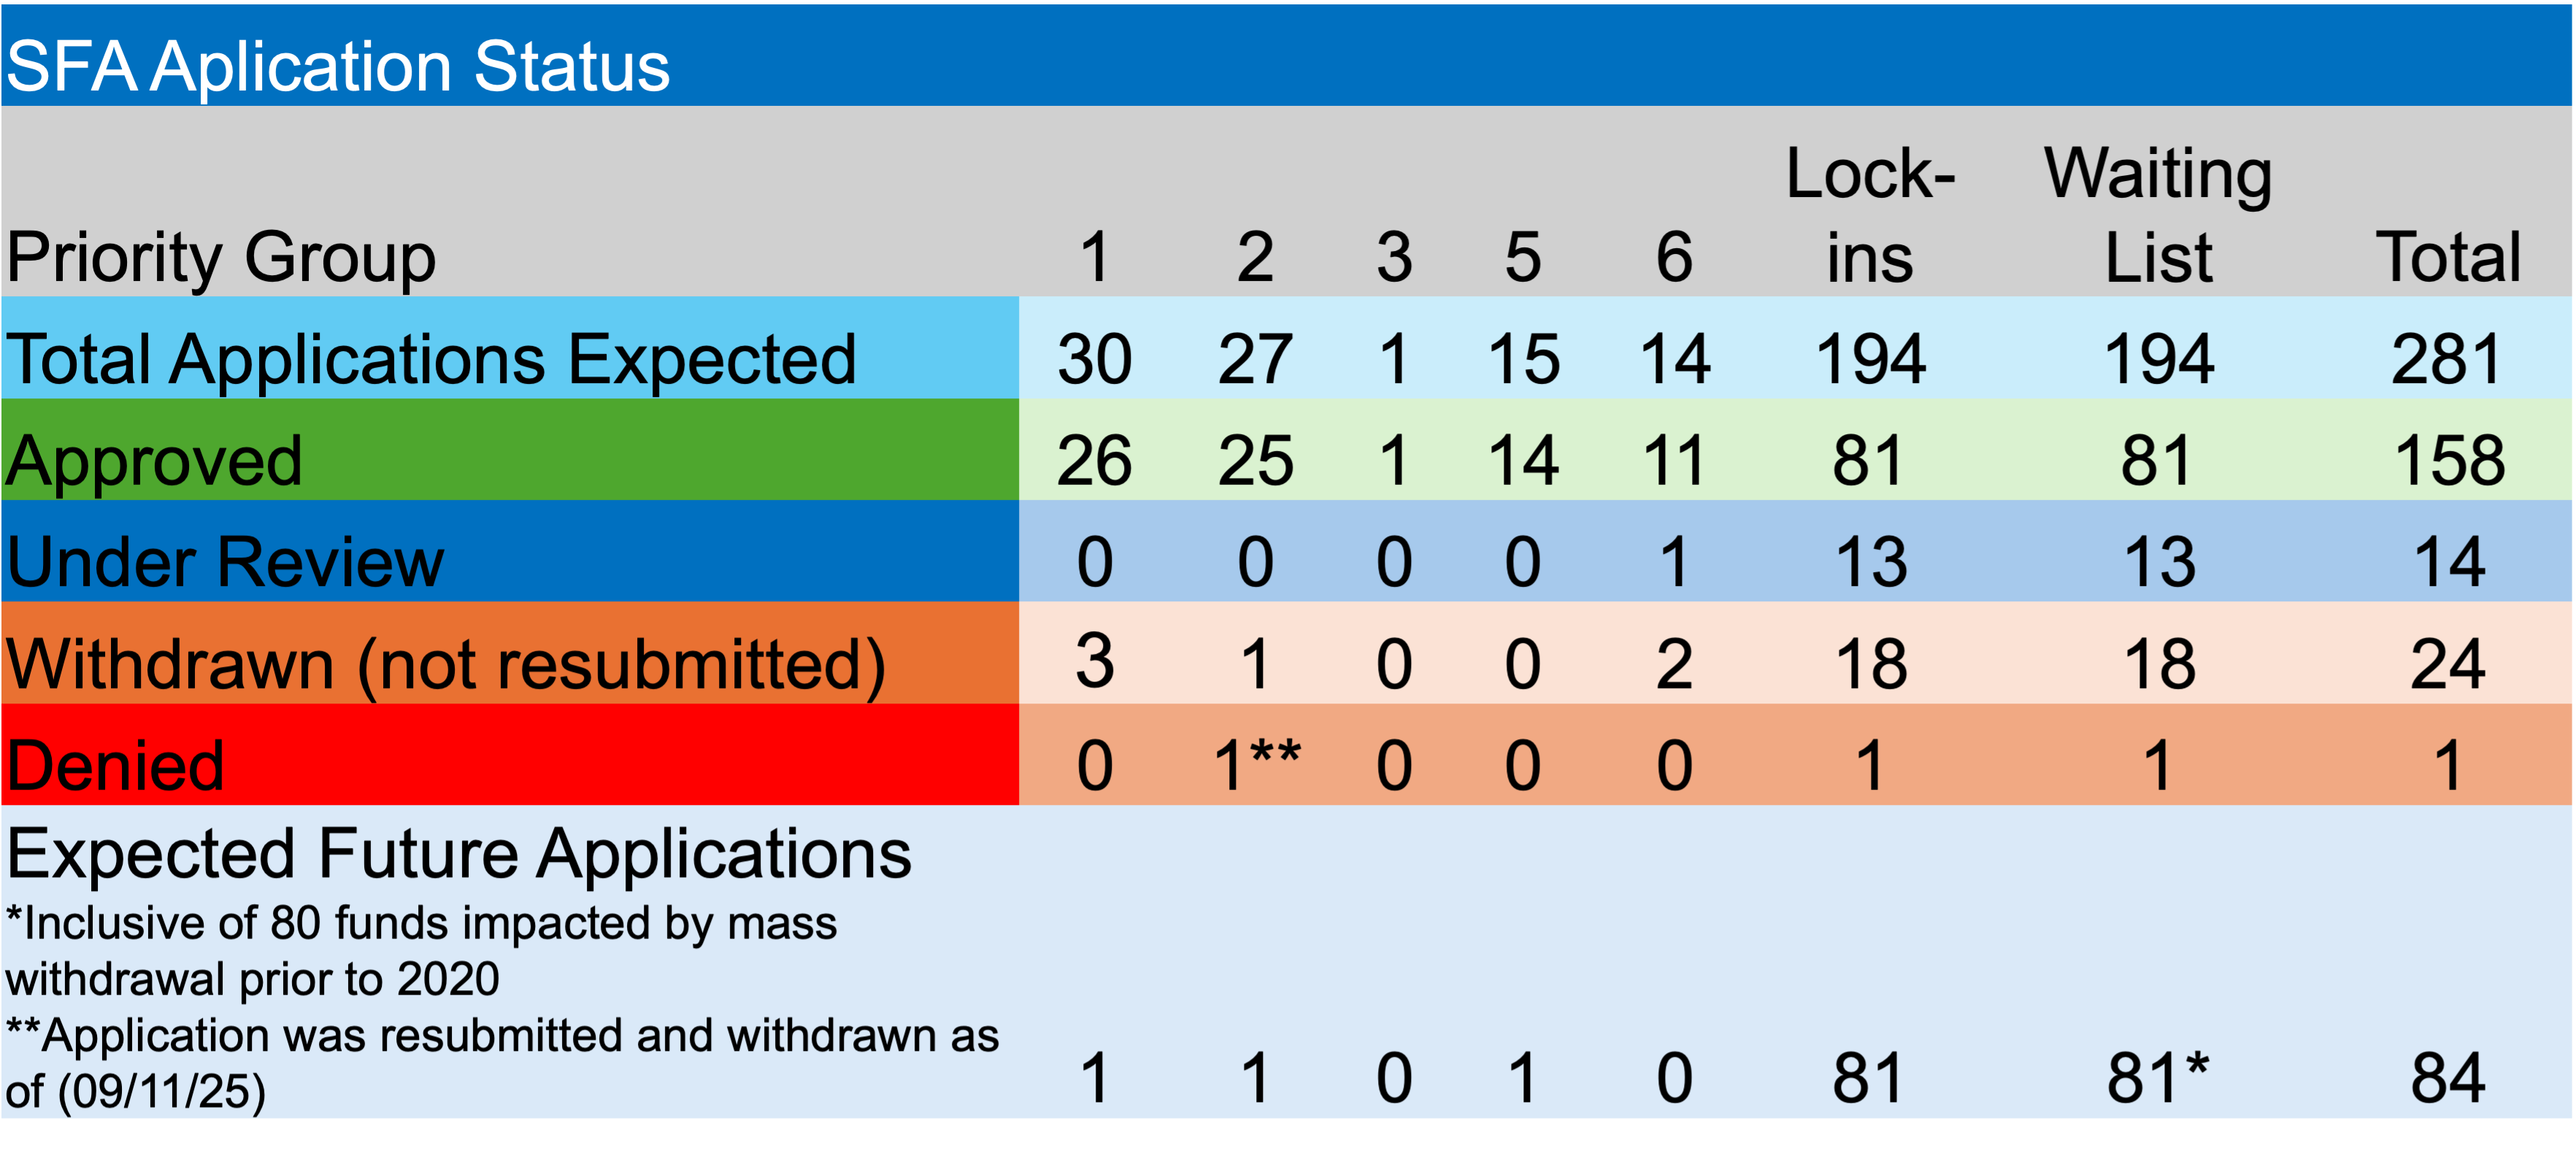
Regarding ARPA and the PBGC’s implementation of this critical pension legislation, last week proved to be fairly quiet, and I imagine it will continue to be so, as the PBGC works through the remaining applications currently under review (14) and those that will likely be resubmitted (25). Quiet, unless some action is taken on the 80 plans sitting on the waitlist that were terminated by mass withdrawal prior to 2020.

During the past week there were no applications approved or denied, no pension plans were asked to repay a portion of their SFA and no pension funds asked to be added to the waitlist.

In other news, there was one revised application filed. Bricklayers Local No. 55 Pension Plan, a non-priority group member, is seeking $6.4 million for its 483 members. The PBGC has 120-days to review and approve the application before it is automatically accepted. The only other news of note related to two pension funds that withdrew applications. Non-priority group member, Retail Bakers’ Pension Trust Fund of St. Louis, withdrew its initial application. They’d been seeking $5.7 million for 566 plan members. Warehouse Employees Union Local 169 and Employers Joint Pension Plan, another non-priority group member, withdrew an already revised application in which they were hoping to secure $77.8 million for 3,609 plan participants.

The uncertainty related to action in Iran has U.S. Treasury yields rising across the Treasury yield curve as inflation concerns once again come into focus. Rising rates are challenging for bond investors unless a cash flow matching (CFM) strategy has been used. As a reminder, CFM will secure the promised benefits (and expenses, if desired) for as long as the SFA allocation lasts. As a reminder, those B&E are future values which are not interest rate sensitive. Importantly, higher interest rates will create more cost savings related to those future promises for pension plans still waiting to receive their SFA.

New Jersey’s Pension System’s “High” Investment Return

By: Russ Kamp, CEO, Ryan ALM, Inc.

As a taxpaying resident in New Jersey and a huge supporter of defined benefit plans who has a daughter in the system, I was happy to read that NJ’s pension systems generated strong investment returns in fiscal year 2025, reporting a nearly 11% return. Terrific. Yet, despite the above target return (7.0% ROA), the impact on the system’s funded status was negative. Yes, the funded ratio improved (assets/liabilities), but the funded status further deteriorated (funding gap in $s). Since the system is striving for 7% and the combined funded ratio of the various plans is <50%, a system like NJ’s would need to double the annual return on asset target just to keep the $ deficit stable.

It is great to see that NJ is finally bringing some financial discipline to the management of its pensions, with contributions at least matching the Actuarial Determined Contribution (ADC), but after decades of failing to do so (I think since Washington slept here), the systems are in need of significant funding improvement. Trying to generate outsized gains through a riskier asset allocation is not a long-term winning formula, often leading to greater annually required contributions when markets behave badly and assets get whacked.

The management of DB pension plans is not rocket science if the basics of sound pension management are followed. For instance, plans receiving the full ADC have on average an 80% funded ratio, while those not receiving the full ADC sit with funded ratios <70% (NCPERS study). Plans sitting with funded ratios below 50% are not likely to create enough excess return relative to the annual ROA to be able to close the funding gap. This often leads to plans making difficult decisions such as creating plans with multiple tiers, which I really despise.

Plans should focus on meeting the ADC, securing the promised benefits in the near-term, which buys time for the growth or alpha assets to perform, and reduce costs of administration, including management fees. DB plans are critical to the creation of a dignified retirement. Having a significant percentage of our seniors lacking the financial wherewithal to remain active in our economy is a major problem with long-term implications.

Good Question!

By: Russ Kamp, CEO, Ryan ALM, Inc.

We occasionally post questions received in reaction to our blogs in new blog posts since many of our readers might have similar thoughts/ideas. In reaction to yesterday’s post, “All-time High Funded Ratio” a reader calling themselves LoudlyObservant (great name) stated the following:

Why wouldn’t such well-funded plans take steps to lock in the funding of their beneficiary payments through a cash flow matching portfolio? Isn’t the first fiduciary duty of loyalty expressed in controlling the relevant risk to the beneficiaries, which involves BOTH securing adequate assets and then actually funding the payments? Many of these plans have hit the first goal but are still exposed to funding risk. With a ready solution at hand, the plan sponsors open themselves to criticism for not acting on their second responsibility.

Thank you, Loudly! Great questions and observations. We often talk about the fact that pension plans at all funding levels need liquidity, not just well-funded plans, but when you have a universe of plans that on average are fully funded, why not dramatically reduce risk. We witnessed what happened to DB pension plans at the end of 1999, when most plans were well overfunded only to see the funded status plummet and contribution expenses explode following two major market corrections.

I’m neither smart enough nor is my crystal ball better than anyone else’s to know if a major market correction is on the horizon but why take the chance unnecessarily. We’ve seen a significant percentage of Special Financial Assistance (SFA) recipients engage in cash flow matching to secure the SFA assets and the benefits that they will protect. Why not adopt CFM for the legacy assets, too? As we’ve mentioned, we are providing a service to you and your plan participants. It isn’t just another product. Time to get off the proverbial rollercoaster of returns and secure the promises and your plan’s funded status.

It Should Be Relative and NOT Absolute

By: Russ Kamp, CEO, Ryan ALM, Inc.

I was participating on a panel at the Opal/LATEC conference yesterday. The moderator asked a question about the importance of process. In my response, I mentioned a number of process elements that are critical to the successful management of pension plans. Here is one point that I made that doesn’t get the attention that it deserves. Many, if not most, defined benefit pension plans have created an investment policy statement (IPS) that specifically restricts certain investments and their respective weights within the pension fund. The plan sponsor and their consultant likely allow investments in public equities and certain styles of equity management (i.e. value and growth, large and small cap, etc.). However, in many cases they restrict the exposure to any one security by an absolute amount such as 5%. This is the wrong approach.

Limiting exposures does reduce the risk that any one stock could have an outsized impact on the pension plan’s return, but by doing so, the plan sponsor is potentially negatively impacting the investment manager. Not all U.S. equity benchmarks are the same and treating them as such is potentially damaging to the manager and fund.

If a large cap growth manager has been retained and they are asked to manage a portfolio relative to the Russell 1000 Growth Index, limiting exposure in a stock to 5% would mean forcing that manager to make a negative bet against any stock in the index that has a weight greater than 5%. As of today, there are three stocks – Nvidia (12.9%), Apple (11.6%), and Microsoft (8.8%) – that the manager couldn’t own at benchmark weight, let alone own them above the index weight. This index is cap weighted, and as the stocks perform well their weight in the index grows. Not being able to own the stock at its index weight is harmful.

Worse, if the investment manager wants to make a positive bet on the stock, they can’t, forcing them to potentially choose weaker companies to round out their portfolio. When a manager is chosen, they are often picked because of their past track record of producing an excess return for a level of risk (tracking error). Restricting exposures to an absolute weight may render those previous return/risk characteristics moot. Furthermore, the exposure to a single stock should be relative to the weight in the index +/- band, which would be very dependent on the amount of tracking error that is comfortable to the plan sponsor.

For instance, a good information ratio (excess return/tracking error) is 0.33%. Meaning that for every 1% excess return, the manager is taking 3% tracking error. If the manager is hoping to add 2% above the benchmark over a cycle, that manager is going to have a tracking error close to 6%. The relative weight of a stock in a portfolio must reflect that level of potential tracking error. Higher tracking error portfolios need more flexibility. In this case, it would make sense to allow the manager to invest in Nvidia at the index weight +/- 2%. For lower risk strategies such as an enhanced index that only has 1% tracking error, perhaps the index weight +/- 0.5% would be appropriate.

Now, the Russell 1000 Growth Index is one of the more concentrated indexes with nearly 60% of the weight of the index in just the top 10 holdings, but it isn’t the only one. Currently, the S&P 500 has the same three stocks (Nvidia, Apple, and Microsoft) at weights greater than 5% and two others, Amazon and Alphabet, at weights >3%. If the manager wants to overweight a holding in the S&P 500 by +/- 2%, they would be restricted with a 5% absolute restriction and no ability to overweight.

I recommend that you review your IPS and make sure that your “risk control” objectives are not restricting your manager’s ability to produce an excess return. Remove any absolute constraint and replace it with a relative weighting based on the tracking error that the manager produces. Again, lower risk enhanced index managers will only need a +/- 0.5% to +/-1% restriction, while higher tracking managers will need greater flexibility.

Another Cockroach!

By: Russ Kamp, CEO, Ryan ALM, Inc.

As most folks were focused on the massive snowstorm that crippled a large swath of the U.S., BlackRock was disclosing another significant loss in one of their private debt funds. In this case, BlackRock TCP Capital, a publicly traded middle-market lending fund, expects to mark down the net value of its assets 19 per cent after a string of troubled loans weighed on results, marking the latest sign of pressure in the private credit market.

BlackRock’s vehicle is a business development company (BDC), which pools together private credit loans and trades like a stock. According to multiple reports, the fund has struggled in part because of its exposure to e-commerce aggregators which are companies that buy and manage Amazon sellers. Furthermore, BDC shares have been hit over the past year. There are currently 156 active BDCs, of which 50 are publicly traded. BDC Investors have concerned over private credit returns, underwriting standards and increased regulatory scrutiny. FINALLY!

Of course, this is not an isolated incident for either private credit/debt in general or specifically BlackRock. As you may recall, BlackRock was forced to reprice a private debt holding from par to zero last November, when Renovo Home Partners, a Dallas-based home-remodeling roll‑up that collapsed into Chapter 7 bankruptcy, triggering a roughly $150 million total loss on a private loan largely held by BlackRock.

Funds managed by BlackRock (notably its TCP Capital Corp. BDC) provided the majority of roughly $150 million in private credit to Renovo, while Apollo’s MidCap Financial and Oaktree held smaller slices. As of late September 2025, lenders were still marking this loan at 100 cents on the dollar, implying expectations of full repayment. This shouldn’t have come as a complete surprise because earlier in 2025, lenders had already agreed to a partial write‑off and debt‑to‑equity swap, trying to stabilize Renovo’s capital structure.

This unfortunate outcome highlights how “mark‑to‑model” valuations in private credit can keep loans at par until very late, then reprice suddenly when a borrower fails. This practice suggest that headline yields in private credit may understate true default and loss severity risk, especially for highly leveraged sponsor‑backed roll‑ups. Yet, it doesn’t seem to have rattled either the market or institutional asset owners who continue to plow significant assets into this opaque and potentially saturated market. It continues to amaze me the number of “searches” being conducted for private credit/debt. Asset classes can get overwhelmed driving down future returns. Do you know what the natural capacity is for this asset class and the manager(s) that you are hiring? Caveat emptor!