By: Russ Kamp, CEO, Ryan ALM, Inc.
So much for escaping the bitter cold in New Jersey by flying to Orlando, FL. The reality is that Orlando is sitting at 25 degrees this morning (Sunday 2/1). Someone is playing a nasty trick on all those snowbirds. It is a good thing for me that I’ll be spending most of my time in a conference room until Wednesday (FPPTA). I hope that you have a great week.
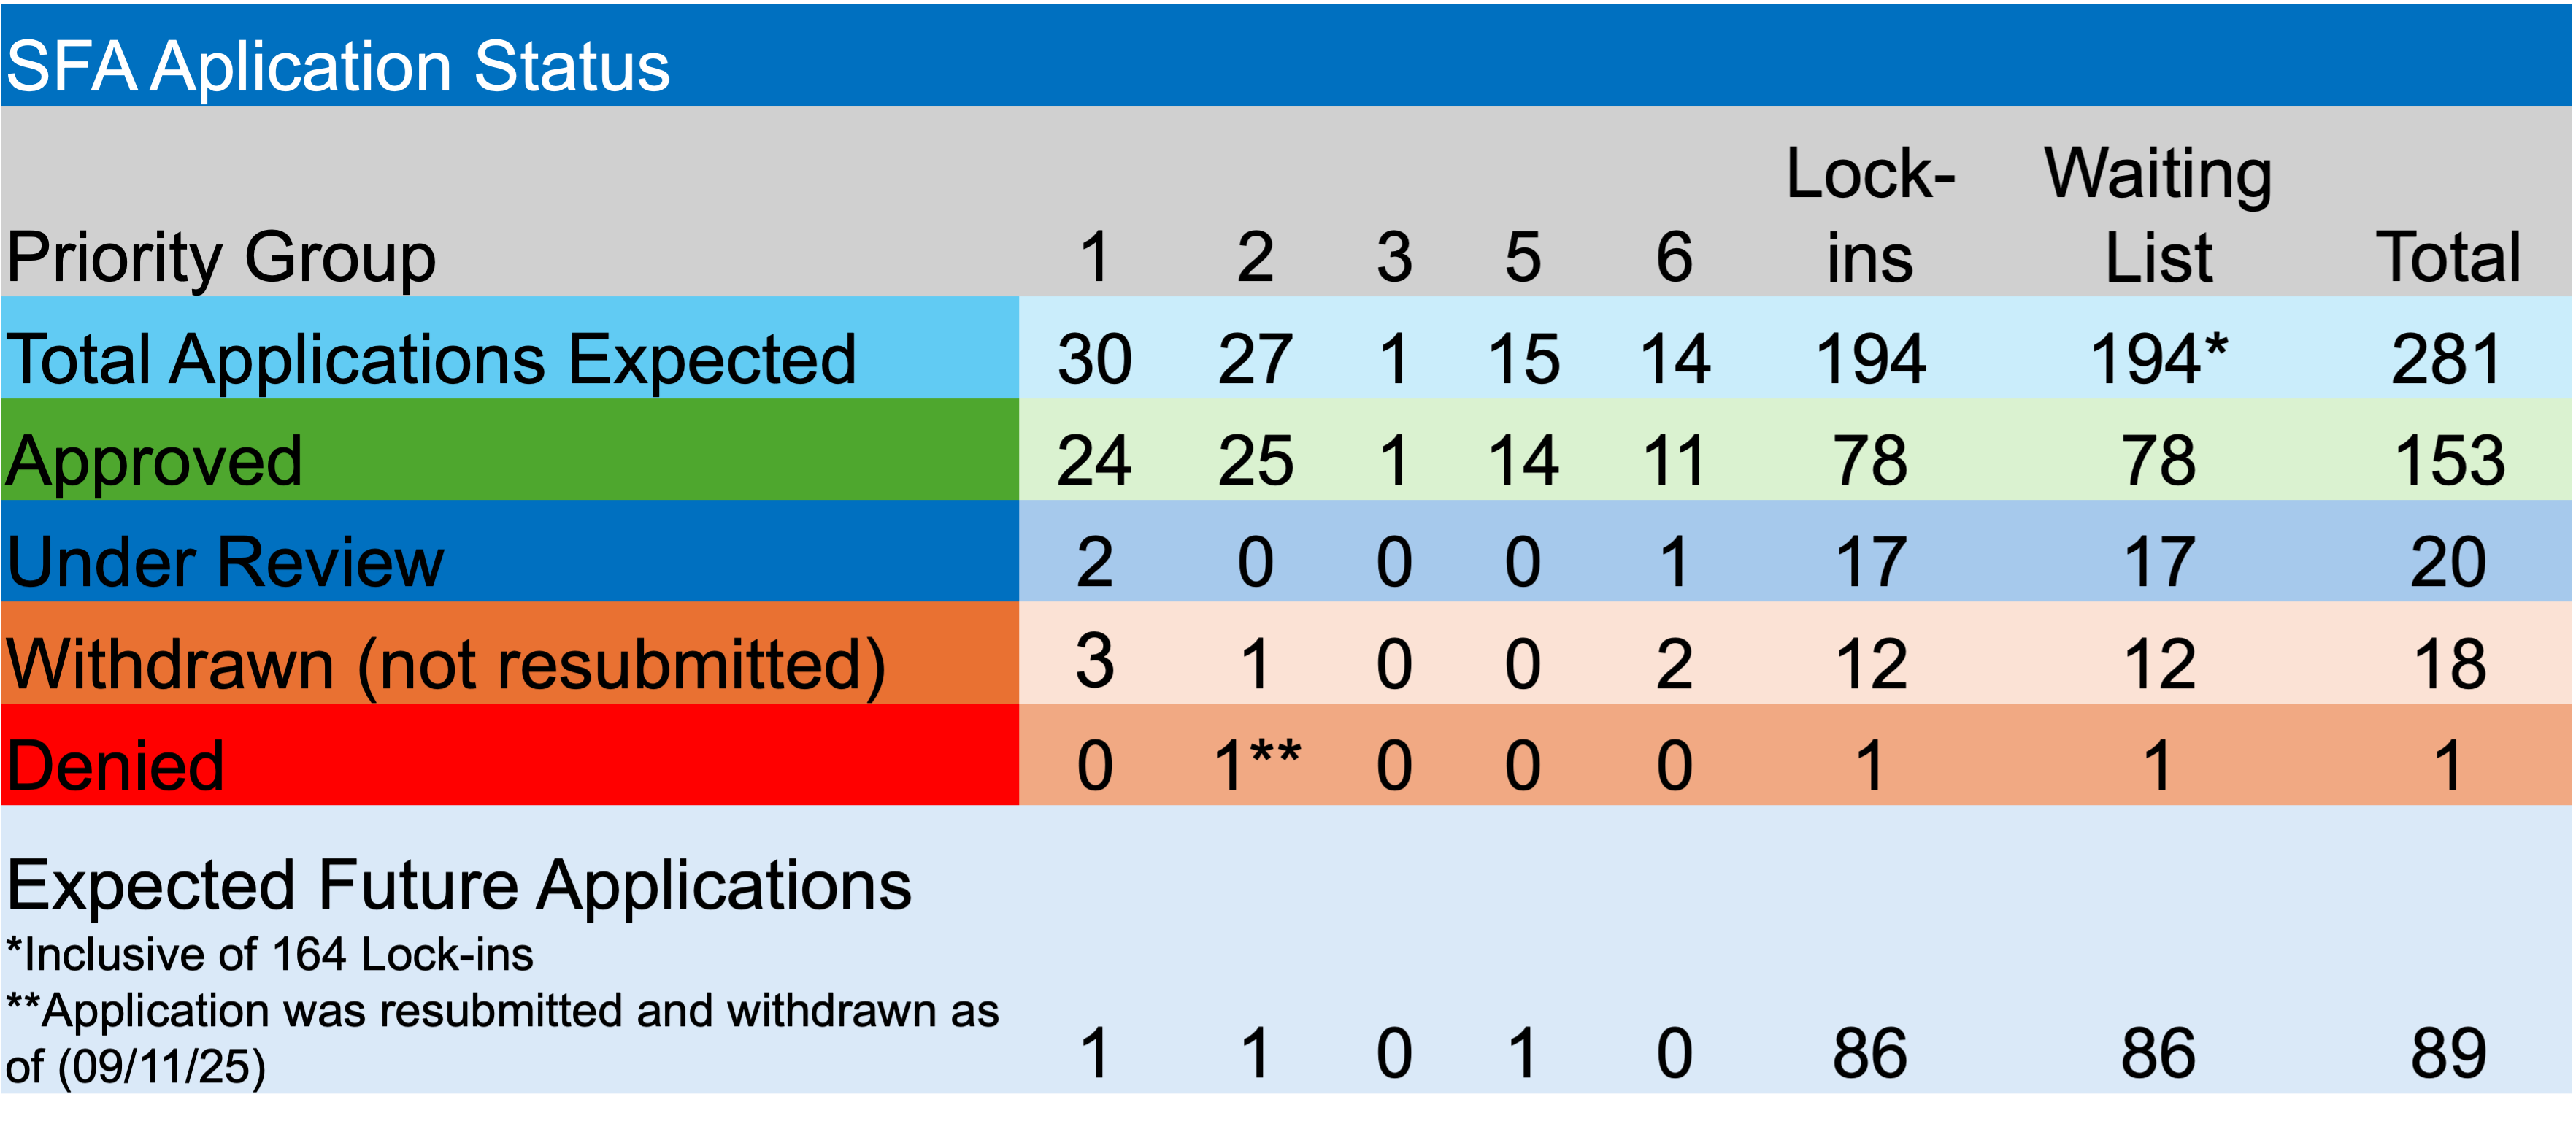
Regarding ARPA and the PBGC’s continuing implementation of this critical legislation, there was activity last week, and some of it was surprising. As I’ve mentioned on several occasions, the ARPA legislation specifically states that all initial applications seeking special financial assistance (SFA) needed to be submitted to the PBGC by 12/31/25. Revised applications could be resubmitted after that date and until 12/31/26. That said, there were three initial applications filed with the PBGC during the week ending January 30th. What gives?
In other news, Cincinnati-based Asbestos Workers Local No. 8 Retirement Trust Plan received approval for SFA. They will get $40.1 million to support their 451 plan participants. In other news, Local 1814 Riggers Pension Plan, withdrew its initial application which had been filed through the PBGC’s e-Filing portal last October. They are hoping to secure a $2.5 million SFA grant for their 65 members.
Fortunately, there were no previous recipients of SFA asked to repay a portion of the grant due to census errors nor were any applications denied due to eligibility issues. Lastly, no new pension plans asked to be added to the waitlist which currently numbers more than 80 systems.

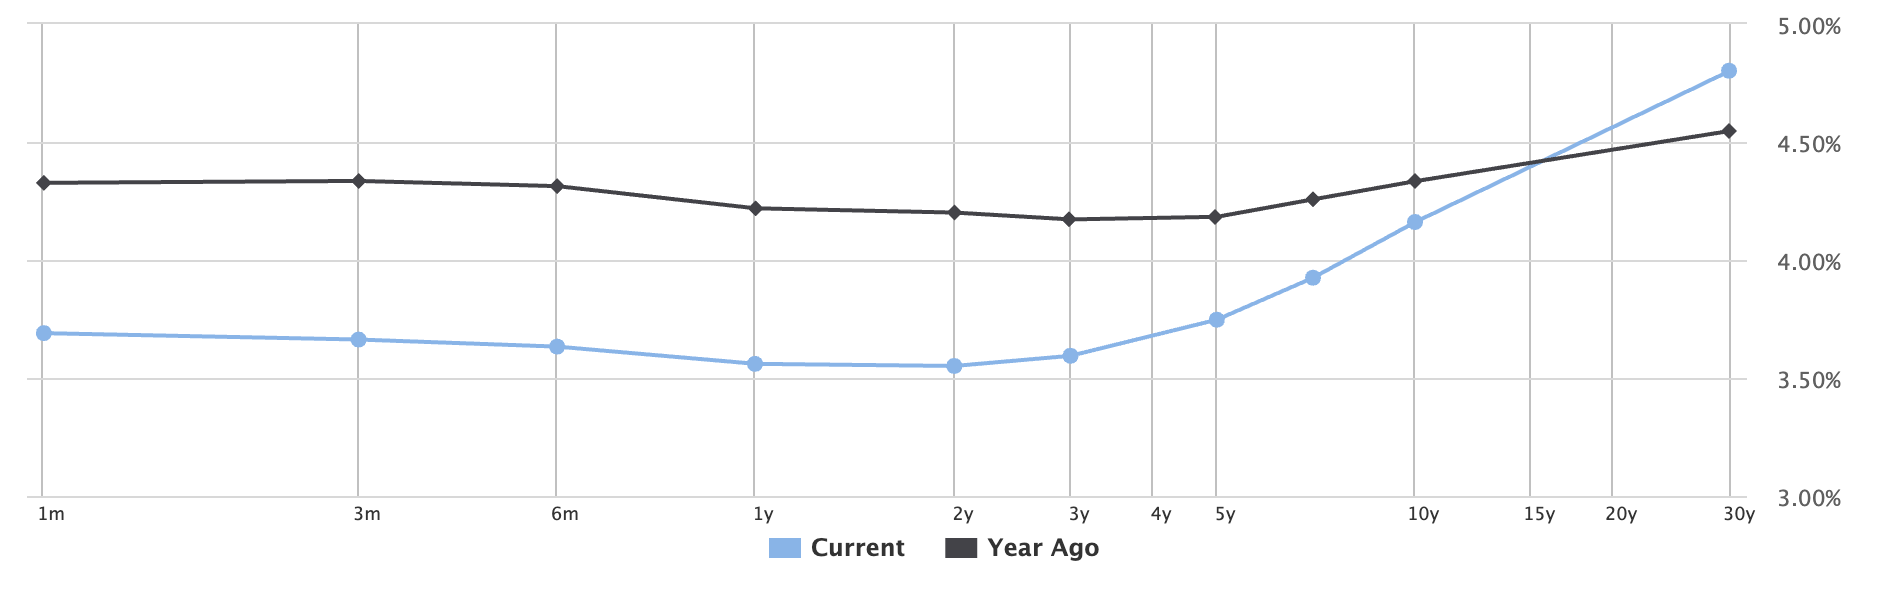
The U.S. Treasury yield curve remains steep, with 30-year bond yields exceeding the yield on the 2-year note by 1.34% as of Friday’s closing prices. This steepening provides plan sponsors and grant recipients with attractive yields on longer maturity cash flow matching programs used to secure the promised benefits.