March Proves Challenging for Core Fixed Income

By: Russ Kamp, CEO, Ryan ALM, Inc.

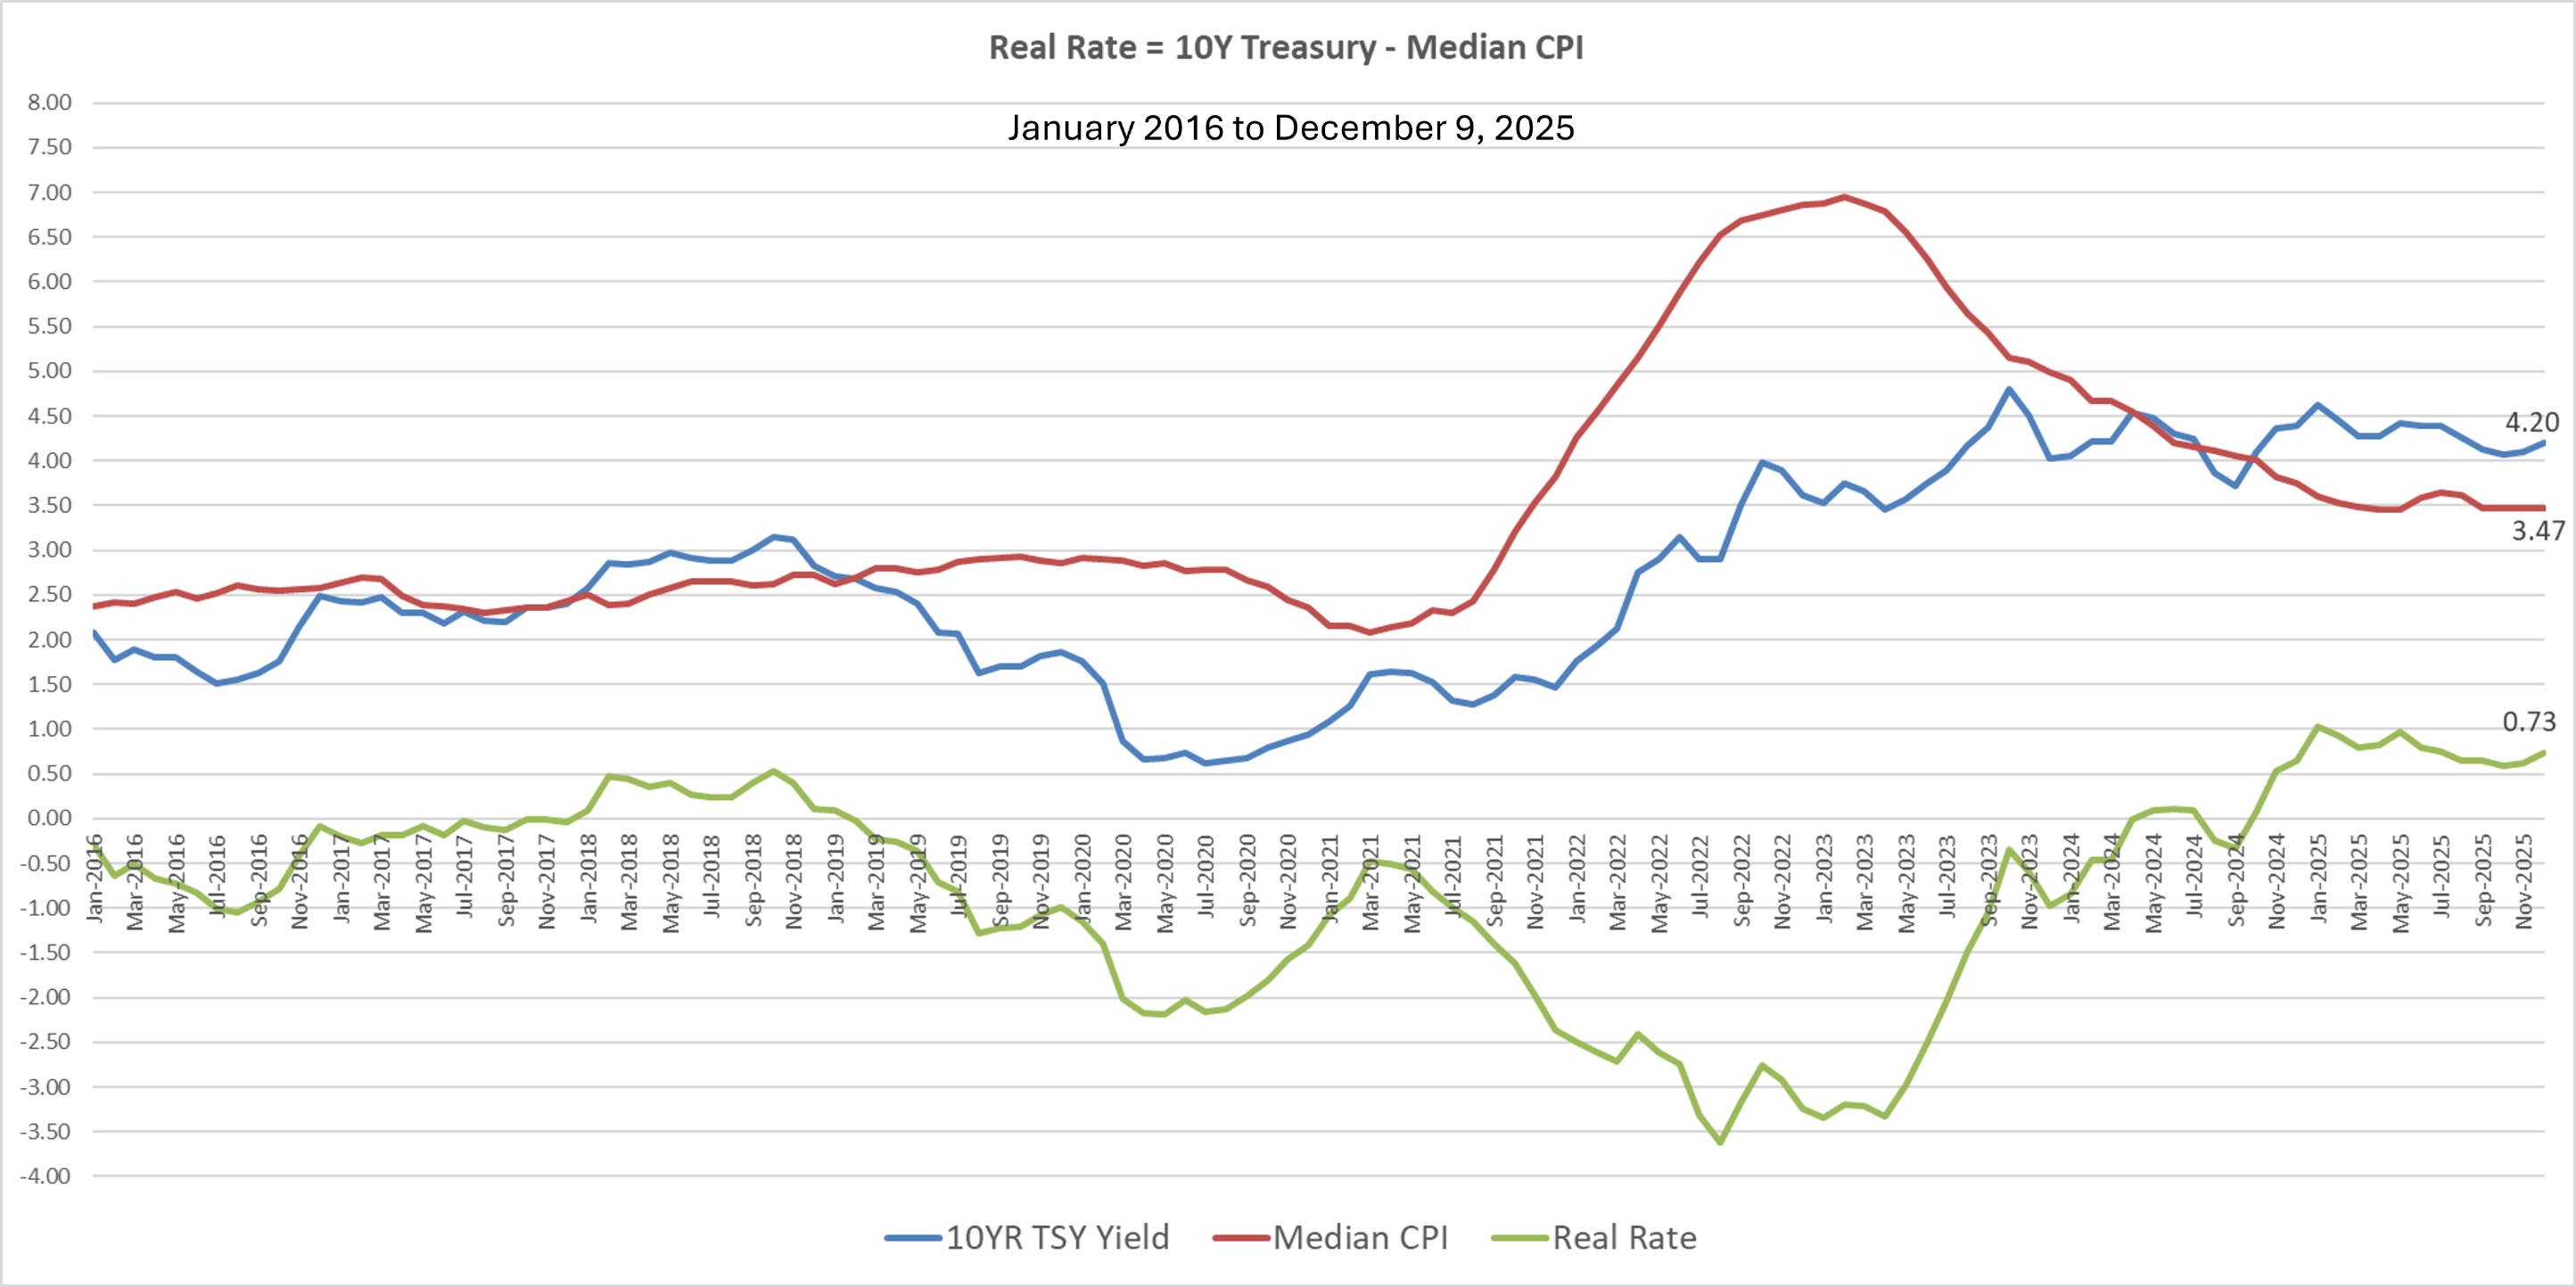
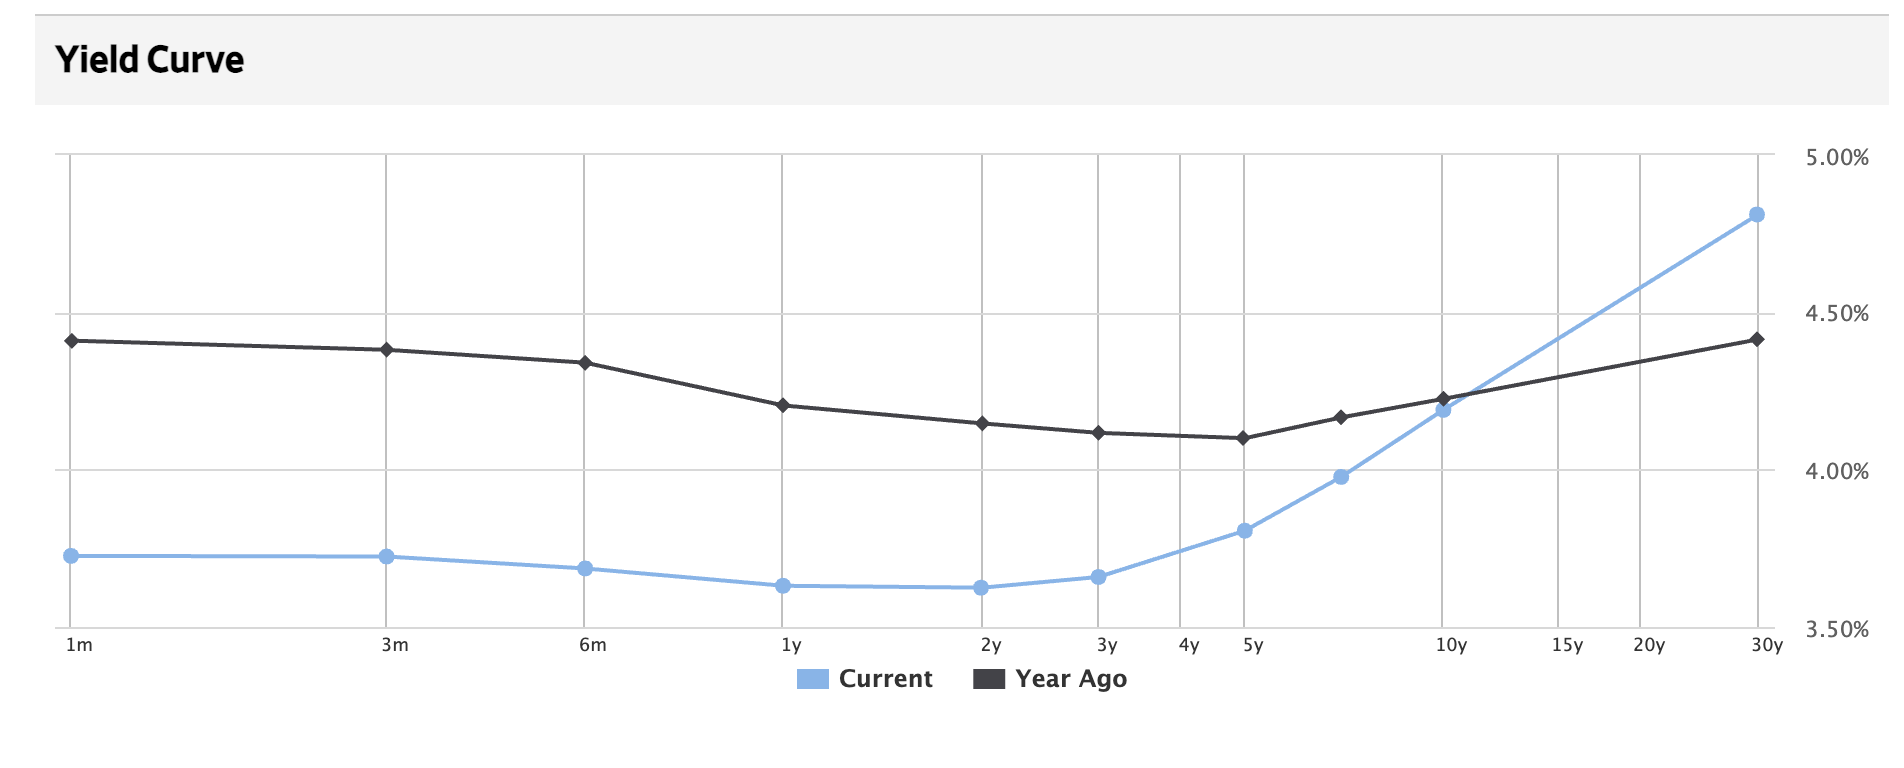
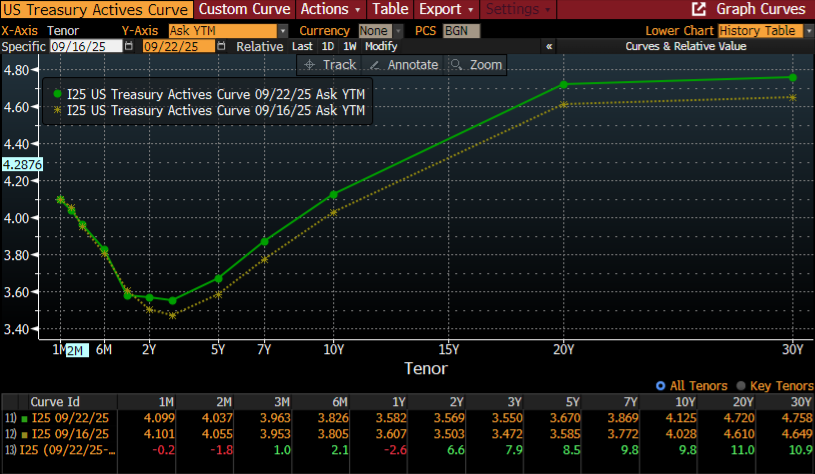
March was a difficult month for active core fixed income managers, as the Bloomberg U.S. Aggregate Index fell -1.8%. Uncertainty related to the impact of the Iran War on oil prices and subsequently inflation, pushed rates higher across the Treasury yield curve. The U.S. 10-year Treasury note saw yields rise 38 bps to 4.31%.

Agencies fell -1.7% in line with Treasuries, while the Corporate sector declined -2.0%. Corporate spreads ended March with an option adjusted spread (OAS) of 88.6 bps. The best performing Corporate sector was Financials (-1.7%), while Utilities performed worst at -2.2%.

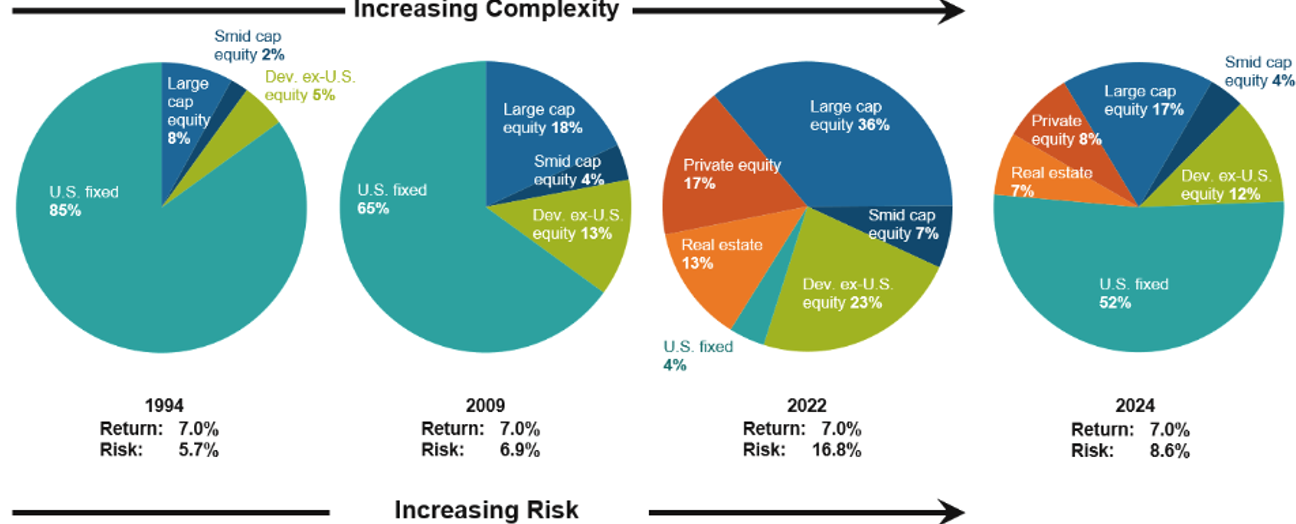
The greatest risk managing bonds is interest rate risk. Given both geopolitical (Iran, Taiwan, Ukraine) and economic risks (oil, inflation, interest rates), now is the time to significantly reduce risk within your fund, whether that be a DB pension or E&F. Why continue to ride active fixed income through these uncertain markets? One can use a cash flow matching (CFM) strategy to SECURE and fund net liabilities chronologically well into the future. In the process, interest rate risk is eliminated as future benefits and expenses are not interest rate sensitive.

Furthermore, by securing near-term liabilities, the non-bond assets can now grow unencumbered providing more time to wade through these challenging times. I have no idea how long this conflict will last. I also don’t know how much damage has occurred and that which might still happen to oil production in the Middle East. Implementing a strategy that doesn’t rely on forecasting U.S. interest rates should be a high priority today.

Making the switch is easy. Rotate your current core fixed income assets from an active investment strategy to a CFM portfolio. There isn’t a need to revisit the fund’s asset allocation. We’ll even look for opportunities to take-in-kind some of your existing holdings. You’ll appreciate not having to search each month for the liquidity to meet the monthly promises that have been made to your participants, as the CFM strategy will provide all the liquidity that you need. Moreover, the Ryan ALM CFM model is skewed to A/BBB+ corporate bonds which should outyield most generic bond indexes that are skewed to Treasuries (e.g. the AGG).


What is My Funded Ratio? Who Cares!

By: Russ Kamp, CEO, Ryan ALM, Inc.

The funded ratio of a DB pension plan gets a lot of attention, especially if it is perceived to be weak. But does the funded ratio truly tell you the whole story as to the financial health of a DB pension plan? We, at Ryan ALM, Inc. don’t think so.

So, how is the funded ratio calculated:

Funded ratio = MV of plan assets / plan liabilities earned to date X 100

The market value of assets is a present value (PV) calculation. The market value of liabilities is the future value of liabilities earned to date discounted back to a PV calculation based on a discount rate. For public and multiemployer plans the discount rate tends to be the fund’s return on asset assumption (ROA), while it is an AA corporate blended rate for private pensions. In today’s interest rate environment, the discount rate for private plans will be roughly 1.5% less than the discount rate based on the average ROA. That means that liabilities for private funds will have a greater current value than the value of liabilities calculated based on the discount rate using the ROA. Oh, okay, so the choice of a discount rate can change my funded ratio. That’s interesting. So that tells me that if I wanted to improve my funded ratio, all I’d have to do is increase my discount rate to lower the PV of my liabilities. That’s very interesting.

So, it appears that the funded ratio calculation can be manipulated to some extent. As we think about the formula above, is there anything missing? Yes, where are the future contributions, which can be significant. Why are future payment liabilities in the calculation, but projected contributions, which are future assets of the fund, not included? Common thinking suggests that those future contributions aren’t guaranteed, which is why they aren’t factored into the funded ratio calculation. However, is that a correct assumption? In doing some research, it appears >80% of DB pension funds receive 100% of the annual required contribution (ARC). Even NJ’s public pension system is making the ARC and then some.

We recently had a conversation with a large plan sponsor who thought that their fund was <50% funded based on the formula above. Not surprisingly, they were very focused on this ratio and looking for investment strategies that could potentially enhance it. As an FYI, this plan’s future contributions as forecasted by their actuary were significant. In fact, future contributions were so large that they were equal to 73% of the forecasted liabilities! Yes, without including the pension fund’s current assets, this plan was 73% funded, provided those projected contributions were met which they have been for more than a decade.

So, given these forecasted contributions is that pension fund really <50% funded?

In another example, the same fund that thought that they were poorly funded, could defease net pension liabilities for the next 33-years. How is it possible that a plan that believes it is <50% funded able to significantly reduce risk, enhance liquidity, and SECURE pension promises for 33-years? Furthermore, this fund was going to establish a $4.4 billion surplus on the day that those benefits and expenses were defeased for 33-years. If it just earned the projected ROA, that $4.4 billion would grow to $34.2 billion during that 33-year period. Wow! 

So, I ask once more, does that sound like a plan in financial distress, which a funded ratio of <50% might suggest? NO!

The funded ratio is but one measure of a pension plan’s health. Unfortunately, many in our industry would look at that # and say that more risk needs to be taken to achieve “full funding” down the road, when in fact reducing risk through a cash flow matching (CFM) strategy is the appropriate approach. It is past the time to get off the scary asset allocation rollercoaster. 

DB Pension Plan “Absolute Truths” Revisited

By: Russ Kamp, CEO, Ryan ALM, Inc.

This post may be familiar to some of you, as I originally published it in October 2024. Given today’s great uncertainty related to geopolitics, markets, and the economy, I thought it relevant to share once again. Please don’t hesitate to reach out to me if you want to challenge any part of this list. We always welcome your feedback.

The four senior members at Ryan ALM, Inc. have collectively more than 160 years of pension/investment experience. We’ve lived through an incredible array of markets during our tenures. We have also witnessed many attempts on the part of Pension America to try various strategies to meet the promises that have been made to the pension plan participants.

Regrettably, defined benefit (DB) pension plans continue to be tossed aside by corporate America in favor of defined contribution (DC) plans. Both public and multiemployer plan sponsors would be wise to adopt a strategy that seeks more certainty to protect and preserve these critically important retirement vehicles before they are subject to a similar fate.

We’ve compiled a list of DB pension “Absolute Truths” that we believe return the management of pension plans back to its roots when SECURING the promised benefits at a reasonable cost and with prudent risk was the primary objective. The dramatic move away from the securing of benefits to the arms race focused on the return on asset assumption (ROA) has eliminated any notion of certainty in favor of far greater variability in likely outcomes.

Here are the Ryan ALM DB Truths:

  • Defined Benefit (DB) pension plans are the best retirement vehicle!
  • They exist to fulfill a financial promise that has been made to the plan participant upon retirement.
  • The primary objective in managing a DB plan is to SECURE the promised benefits at a reasonable cost and with prudent risk.
  • The promised benefit payments are liabilities of the pension plan sponsor.
  • Liabilities need to be measured, monitored, and managed more than just once per year.
  • Liabilities are future value (FV) obligations – a $1,000 monthly benefit is $1,000 no matter what interest rates do. As a result, they are not interest rate sensitive.
  • Pension inflation is not equal to the CPI but a rate unique to each plan sponsor.
  • Best way to hedge pension inflation is through Cash Flow Matching (CFM) since inflation is in the actuarial projections
  • Plan assets (stocks, bonds, real estate, etc.) are present value (PV) or market value (MV) calculations. We do not know the FV of assets except for bonds cash flows (interest and principal at maturity).
  • To measure and monitor the funded status, liabilities need to be converted from FV to PV – a Custom Liability Index (CLI) is absolutely needed.
  • A discount rate is used to create a PV for liabilities – ROA (publics), ASC 715 (corps), STRIPS, etc.
  • Liabilities are bond-like in nature. The PV of future liabilities rises and falls with changes in the discount rate (interest rates).
  • The nearly 40-year decline in US interest rates beginning in 1982 crushed pension funding, as the growth rate for future liabilities far exceeded the growth rate of assets.
  • The allocation of plan assets should be separated into two buckets – Liquidity (beta) and Growth (alpha).
  • The liquidity assets should consist of a bond portfolio that matches (defeases) asset cash flows with the plan’s liability cash flows (benefits and expenses (B&E)).
  • This task is best accomplished through a CFM investment process.
  • The liquidity assets should be used to fund B&E chronologically buying time for the alpha assets to grow unencumbered in their quest to meet those faraway future liabilities not yet defeased by the liquidity assets.
  • The Growth assets will consist of all non-bonds, which can now grow unencumbered, as they are no longer a source of liquidity. Growth assets will fund those remaining future liabilities not yet defeased by the liquidity assets.
  • The Return on asset (ROA) assumption should be a calculated # derived through an Asset Exhaustion Test (AET)
  • The pension plan’s asset allocation should be responsive to the plan’s funded status and not the ROA.
  • As the funded status improves, port alpha (profits) from the Growth portfolio into the Liquidity bucket (de-risk) extending the cash flow matching assignment and securing more promises.
  • This de-risking ensures that plans don’t continue to ride the asset allocation rollercoaster leading to volatile contribution costs.
  • DB plans are a great recruiting and retention tool for managing a sponsor’s labor force.
  • DB plans need to be protected and preserved, as asking untrained individuals to fund, manage, and then disburse a “benefit” through a Defined Contribution plan is poor policy.
  • Unfortunately, doing the same thing over and over and over is not working. A return to pension basics is critical.

You’ve made a promise: measure it – monitor it – manage it – and SECURE it…   

Get off the pension funding rollercoaster – sleep well!

Eliminate the Uncertainty

By: Russ Kamp, CEO, Ryan ALM, Inc.

There are many benefits to using Cash Flow Matching (CFM) for your pension plan, endowment or foundation. The obvious benefit is the liquidity that is created to meet ongoing expenditures, whether benefit payments or grants. That liquidity comes at a premium today for many entities that have migrated significant financial resources to alternative investments, which are having a difficult time providing their investors with capital distributions.

The other significant benefit is the certainty that comes from using CFM. I’ve appreciated the opportunity to speak at NCPERS, IFEBP, LATEC, and OPAL in the last few months and in each case, I asked the audience if there was any investment strategy within their fund that brought certainty? Not a single hand was raised. They could have mentioned cash reserves as an example, but that is an expensive long-term strategy because of the low short-term yields available today.

The cloud of uncertainty under which we live is not comfortable! Yes, both pension funds and E&Fs are long-term investors, but the riding of markets up and down often leads to a significant increase in the contributions necessary to maintain their funding. That activity is not helpful to anyone. Who knows what will transpire as our country navigates through several potential geopolitical landmines. Combine that reality with uncertain economic growth, weaker labor markets, sticky inflation, and equity valuations that seem stretched, and markets could be in for a rocky period.

Wouldn’t it be a blessing to have CFM in place that not only provides the necessary liquidity so that assets aren’t forced to be sold at less than opportune times, but a strategy (service) that provides certainty since your obligations (liability cash flows) are matched with asset cash flows of bond principal and interest income for as far out as the bond and cash allocation will provide. It isn’t often that we are presented with an investment strategy that is truly a sleep-well-at-night offering for the long term. 

As a reminder, humans hate uncertainty, as it impacts us in both psychological and physiological ways. Yet, in the management of pensions and E&Fs, sponsors have wholeheartedly embraced uncertainty. The disconnect is quite surprising. Again, I don’t know what will transpire in markets today, tomorrow, or next year. I don’t know how the Iran situation will impact shipping lanes and the price of oil and inflation or worse, destabilize the entire region by bringing into the conflict Iran’s friends, such as Russia and China. I’m not a gambler and I don’t believe that managers of pension assets should be either.

I think it is critically important to SECURE the promises given to your plan’s participants and to achieve that objective with low cost and prudent risk. Riding the asset allocation rollercoaster accomplishes neither objective. Now’s the time to act. Not after markets have been rocked.

“Everybody’s looking under every rock.” Jay Kloepfer

By: Russ Kamp, CEO, Ryan ALM, Inc.

Institutional Investor’s James Comtois has recently published an article that quoted several industry members on the near-term (10-years) return forecast for both public and private markets, which according to those asked are looking anemic. No one should be surprised by these forecasts given the incredible strength of public markets during the past three years and the fact that regression to the mean tendencies is not just theory.

An equally, if not greater, challenge is liquidity. As the title above highlights, Jay Kloepfer, Director of Capital Markets Research at Callan, told II that “Liquidity has become a bigger issue,” He went on to say that “Everybody’s looking under every rock.” Not surprising! Given the migration of assets from public markets to private during the last few decades. The rapid decline in U.S. interest rates certainly contributed to this asset movement, but expectations for “outsized” gains from alternatives also fueled enthusiasm and action. The Callan chart below highlights just how far pension plans have migrated.

I’ve written a lot on the subject of liquidity. Of course, the only reason that pension plans exist is to fund a promise that was made to the participants of that fund. Those promises are paid in monthly installments. Not having the necessary liquidity can create significant unintended consequences. No one wants to be a forced seller in a liquidity challenged market. It is critical that pension plans have a liquidity policy in place to deal with this critical issue. Equally important is to have an asset allocation that captures liquidity without having to sell investments.

Cash flow matching (CFM) is such a strategy. It ensures that the necessary liquidity is available each and every month through the careful matching of asset cash flows (interest and principal) with the liability cash flows of benefits and expenses. No forced selling! Furthermore, the use of CFM extends the investing horizon for those growth assets not needed in the CFM program. Those investments can just grow unencumbered. The extended investing horizon also allows the growth assets to wade through choppy markets without the possibility of being sold at less than opportune times.

So, if you are concerned about near-term returns for a variety of assets and with creating the necessary liquidity to meet ongoing pension promises, don’t rely on the status quo approach to asset allocation. Adopt a bifurcated asset allocation that separates plan assets into liquidity and growth buckets. Your plan will be in much better shape to deal with the inevitable market correction.

How Does One Secure A Benefit?

By: Russ Kamp, CEO, Ryan ALM, Inc.

We hope that you’ll agree that going to Chicago in January demonstrates the lengths that Ryan ALM personnel will go to help plan sponsors and their advisors protect and preserve DB pension plans. We are just thankful that we left yesterday, as today’s temperature is not expected to get to 0. OUCH!

Ron Ryan and I spent the last couple of days speaking with a number of funds and consultants about the many benefits of cash flow matching (CFM), which is gaining incredible traction among pension sponsors of all types. Who doesn’t want an element of certainty and enhanced liquidity within their plans given all the uncertainty we are facing in markets and geopolitically.

The idea of creating an element of certainty within the management of pension plans sounds wonderful, but how is that actually achieved? This is a question that we often receive and this trip was no exception. We had been discussing the fact that the relationship between asset cash flows (bond principal and interest) and liability cash flows (benefits and expenses) is locked in on the day that the bond portfolio is produced. The optimization process that we created blends the principal and interest from multiple bonds to meet the monthly obligations of benefits and expenses with an emphasis on longer maturity and higher yielding bonds to capture greater cost reduction of those future promises.

However, to demonstrate how one defeases a future liability, my example below highlights the matching of one bond versus one future $2 million 10-year liability. In this example from 18-months ago we purchased:

Bond: MetLife 6.375% due 6/15/34, A- quality, price = $107.64

Buy $1,240,000 par value of MetLife at a cost = $1,334,736

Interest is equal to the par value of bonds ($1,240,000) times the bond’s coupon (6.375%)

As a result of this purchase, we Receive: 

  Interest =  $78,412.50 annually ($39,206.25 semi-annual payments)

                            Total interest earned for 10 years is $784,125

  Principal = $1,240,000 at maturity (par value)

Total Cash Flow = $2,024,125  – $2,000,000 10-year Liability  = $24,124.99 excess

                             ($24,124.99 excess Cash Flow)

Benefits:

Able to fund $2 million benefit at a cost of $1.335 million or a -33.25% cost reduction

Excess cash flow can be reinvested or used to partially fund other benefits

In today’s yield environment, our clients benefit to a greater extent asking us to create longer maturity programs given the steepness of the yield curve. If they don’t have the assets to fund 100% of those longer-term liabilities, we can defease a portion of them through what we call a vertical slice. That slice of liabilities can be any percentage that allows us to cover a period from next month to 30-years from now. In a recent analysis produced for a prospect, we constructed a portfolio of bonds that covered 40% of the pension plan’s liabilities out to 30-years. As a result, we reduced the present value cost to defease those liabilities by –42.7%!!

Reach out to us today to learn how much we can reduce the future value cost of your promised benefits. We do this analysis for free. We encourage you to take us up on our generous offer.

FV Benefits Reduced by -56.1% – Really!

By: Russ Kamp, CEO, Ryan ALM, Inc.

I truly relish getting feedback related to my blog posts. I wasn’t surprised that there was more activity, and a little skepticism, related to my recent post that discussed the output from a current project. You may recall the post titled, “Bond Math and A Steepening Yield Curve – Perfect Together”, in which I shared that one particular Cash Flow Matching (CFM) implementation resulted in a potential -56.1% reduction in the FV cost of promised pension benefits. A few folks questioned the math, while another made the comment that the “savings” or cost reduction was nothing more than the time value of money. But isn’t that the reason to have pension assets in the first place so you are not funding liabilities at 100 cents on the dollar (pay-as-you-go).

Well, here’s the thing, the use of bonds, the only asset class with a known cash flow (future value at maturity and contractual semi-annual interest payments), brings to the management of pensions an element of certainty not found elsewhere. Yes, it is conceivable that one could cobble together a group of investment strategies that might subsequently achieve a targeted return that would help pay those obligations, but the volatility associated with this return-focused approach may also lead to significant underperformance and higher contribution expenses in the process.

With CFM, the savings (cost reduction) gets locked in on day one of the assignment. Give us a 5-year, 10-year, or longer assignment to secure those promised benefits, and we’ll be able to give you the likely return for that entire period. What other investment strategy can do that? Furthermore, CFM provides the necessary liquidity without forced selling or the sweep of dividends, interest, and capital distributions that should be reinvested in those higher returning strategies. In the process, the investing horizon for the plan’s assets is extended enhancing the probability that they will achieve the desired outcome.

In the example used in the previous Blog post, the -56.1% cost reduction was achieved with only 40% of the plan’s assets. By using a vertical slice approach, in which we secure a portion of the monthly obligations, we were able to extend the coverage period from 11-years to 30-years. That extension allowed us to use longer maturity bonds at substantially higher yields, which took advantage of bond math that proclaims that the longer the maturity and the higher the yield, the lower the cost. It’s true!

In today’s interest rate environment in which the average BBB corporate bond is trading at a yield close to 6%, a pension plan can capture roughly 89% of the target return (6.75% average ROA) with little to no volatility. How wonderful! Given that humans hate uncertainty, why don’t plan sponsors adopt the use of CFM to bring some certainty to their pension systems? Why do they choose to continue to ride the rollercoaster of returns provided by markets leading to increased contributions following down markets?

So, if you are still skeptical regarding our ability to provide significant cost reductions specific to your set of liabilities, allow us to provide you with a FREE analysis highlighting how CFM can support your pension plan and the plan’s participants. There may not be such a thing as a free lunch, but we can provide you with a sleep-well-at-night strategy.

Something Has Got to Give

By: Russ Kamp, CEO, Ryan ALM, Inc.

Not surprisingly, the U.S. Federal Reserve’s FOMC lowered rates another 25 bps today. The new target is 3.75%-4.0%, down from 4.5%-4.75% during the last 3 meetings. Currently, the 10-year Treasury yield (4.145% at 3:21 pm EST) is only marginally greater than the median CPI (Latest reading from the Cleveland Fed is 3.5% annually).

Ryan ALM, Inc.’s Head Trader, Steve DeVito put together the following comparison.

Steve is comparing the 10-year Treasury note yield (blue) versus the Median CPI (red) since January 2016. The green line is the “real” yield (10-year Treasury – the median CPI). For this period of time, there has been very little real yield, as U.S. rates were driven to historic lows before inflation spiked due to Covid-19 factors. However, historically (1962-2025), the real yield has average 2%. With rates down and inflation remaining stubbornly steady to increasing slightly, the real yield that investors are willing to take is, and has been, quite modest (0.17% since 2008). Why? Were the historically low rates in reaction to covid-19 an anomaly, or has something changed from an investor standpoint? Given today’s fundamentals, one might assume that investors are anticipating a sudden reversal in inflation, but is that a smart bet?

The WSJ produced the graph in today’s edition highlighting the change in the U.S. Treasury yield curve during the last year. As one can clearly see, the yield curve has gotten much steeper with the 30-year Treasury bond yield 0.4% above last year’s level (at 4.81%). That steepness would indicate to me that there is more risk longer term from inflation potentially rising.

So, it seems as if something has to give. If inflation remains at these levels, the yield on the 10-year Treasury note should be about 1.25% greater than today. If in fact, yields were to rise to that level, active core fixed income managers would see significant principal losses. However, cash flow matching managers and their clients would see the potential for greater cost reduction in the defeasing of pension liabilities, especially for longer-term programs. Bond math is very straight forward. The longer the maturity and the higher the yield, the greater the cost savings.

Managing a pension plan should be all about cash flows. That is asset cash flows versus liability cash flows of benefits and expenses. Higher yields reduce the future value of those promises. Remember, a CFM strategy is unique in that it brings an element of certainty (barring a default) to the management of pensions which live in a world of great uncertainty. Aren’t you ready for a sleep-well-at-night strategy?

Remember: NO Free Lunch!

By: Russ Kamp, CEO, Ryan ALM, Inc.

In 1938, journalist Walter Morrow, Scripps-Howard newspaper chain, wrote the phrase “there ain’t no such thing as a free lunch”. The pension community would be well-served by remembering what Mr. Morrow produced more than eight decades ago. Morrow’s story is a fable about a king who asks his economists to articulate their economic theory in the fewest words. The last of the king’s economists utters the famous phrase above. There have been subsequent uses of the phrase, including Milton Friedman in his 1975 essay collection, titled “There’s No Such Thing as a Free Lunch”, in which he used it to describe the principle of opportunity cost.

I mention this idea today in the context of private credit and its burgeoning forms. I wrote about capacity concerns in private credit and private equity last year. I continue to believe that as an industry we have a tendency to overwhelm good ideas by not understanding the natural capacity of an asset class in general and a manager’s particular capability more specifically. Every insight that a manager brings to a process has a natural capacity. Many managers, if not most, will eventually overwhelm their own ideas through asset growth. Those ideas can, and should be, measured to assess their continuing viability. It is not unusual that good insights get arbitraged away just through sheer assets being managed in the strategy.

Now, we are beginning to see some cracks in the facade of private credit. We have witnessed a significant bankruptcy in First Brands, a major U.S. auto parts manufacturer. Is this event related to having too much money in an asset class, which is now estimated at >$4 trillion.? I don’t know, but it does highlight the fact that there are more significant risks investing in private deals than through public, investment-grade bond offerings. Again, there is no free lunch. Chasing the higher yields provided by private credit and thinking that there is little risk is silly. By the way, as more money is placed into this asset class to be deployed, future returns are naturally depressed as the borrower now has many more options to help finance their business.

In addition, there is now a blurring of roles between private equity and private credit firms, which are increasingly converging into a more unified private capital ecosystem. This convergence is blurring the historic distinction between equity sponsors and debt providers, with private equity firms funding private credit vehicles. Furthermore, we see “pure” credit managers taking equity stakes in the borrowers. So much for diversification. This blurring of roles is raising concerns about valuations, interconnected exposures, and potential conflicts of interest due to a single manager holding both creditor and ownership stakes in the same issue.

As a reminder, public debt markets are providing plan sponsors with a unique opportunity to de-risk their pension fund’s asset allocation through a cash flow matching (CFM) strategy. The defeasement of pension liabilities through the careful matching of bond cash flows of principal and interest SECURES the promised benefits while extending the investing horizon for the non-bond assets. There is little risk in this process outside of a highly unlikely IG default (2/1,000 bonds per S&P). There is no convergence of strategies, no blurring of responsibilities, no concern about valuations, capacity, etc. CFM remains one of the only, if not the only, strategies that provides an element of certainty in pension management. It isn’t a free lunch (we charge 15 bps for our services to the first breakpoint), but it is as close as one will get!

Buy on the Rumor…

By: Russ Kamp, CEO, Ryan ALM, Inc.

After 44-years in the investment industry I’ve pretty much heard most of the sayings, including the phrase “buy on the rumor and sell on the news”. I suspect that most of you have probably heard those words uttered, too. However, it isn’t always easy to point out an example. Here is graph that might just do the trick.

There had been significant anticipation that the U.S Federal Reserve would cut the Fed Funds Rate and last week that expectation was finally realized with a 0.25% trimming. However, it appears that for some of the investment community that reduction wasn’t what they were expecting. As the graph above highlights, the green line representing Treasury yields as of this morning, have risen nicely in just the last 6 days for most maturities 3 months and out, with the exception of the 1-year note. In fact, the 10- and 30-year bonds have seen yields rise roughly 10 bps. Now, we’ve seen more significant moves on a daily basis in the last couple of years, but the timing is what has me thinking.

There are still many who believe that this cut is the first of several between now and the end of 2025. However, there is also some trepidation on the part of some in the bond world given the recent rise in inflation after a prolonged period of decline. As a reminder, the Fed does have a dual mandate focused on both employment and inflation, and although the U.S. labor force has shown signs of weakening, is that weakness creating concerns that dwarf the potential negative impact from rising prices? As stated above, there may also have been some that anticipated the Fed surprising the markets by slicing rates by 0.50% instead of the 0.25% announced.

In any case, the interest rate path is not straight and with curves one’s vision can become obstructed. What we might just see is a steepening of the Treasury yield curve with longer dated maturities maintaining current levels, if not rising, while the Fed does their thing with short-term rates. That steepening in the curve is beneficial for cash flow matching assignments that can span 10- or more years, as the longer the maturity and the higher the yield, the greater the cost reduction to defease future liabilities. Please don’t let this attractive yield environment come and go before securing some of the pension promises.