That’s Not Right!

By: Russ Kamp, Managing Director, Ryan ALM, Inc.

I’ve recently had a series of terrific meetings with consultants, actuaries, and asset owners (mostly pension plans) about cash flow matching (CFM). I believe that most folks see the merit in using CFM for liquidity purposes, but often fail to see the benefit of bringing certainty to a portfolio for that segment that is defeasing asset cash flows relative to liability cash flows (benefits and expenses). I’m not entirely sure why that is the case, but one question comes up regularly. Question: If I use 30% of my assets on lower yielding fixed income, how am I supposed to meet my ROA objective? I guess that they believe that the current 4.75% to 5% yielding investment grade corporate portfolio will be an anchor on the portfolio’s return.

What these folks fail to understand is the fact that the segment of the portfolio that is defeasing liability cash flows is matched as precisely as possible. The pension game has been won! If the defeased bond portfolio represents 30% of the total plan, the ROA objective is now only needed to be achieved for the 70% of assets not used to SECURE your plan’s liabilities. The capital markets are highly uncertain. Using CFM for a portion of the plan brings greater certainty to the management of these programs. Furthermore, we know that time (investing horizon) is one of the most important investment tenets. The greater the investing horizon the higher the probability of achieving the desired outcome, as those assets can now grow unencumbered as they are no longer a source of liquidity.  It bears repeating… a major benefit of CFM is that it buys time for the growth assets to grow unencumbered.

Plan sponsors should be looking to secure as much of the liability cash flows (through a CFM portfolio) as possible eliminating the rollercoaster return pattern that ultimately leads to higher contribution expenses. As mentioned above, capital markets are highly uncertain. The volatility associated with a traditional asset allocation framework has recently been calculated by Callan as +/-33.6% (2 standard deviations or 95% of observations). Why live with that uncertainty? In addition, Goldman Sachs equity strategy team “citing today’s high concentration in just a few stocks and a lofty starting valuation” forecasts that the S&P 500 “will produce an annualized nominal total return of just 3% the next 10 years, according to the team led by David Kostin, which would rank in just the 7th percentile of 10-year returns since 1930.” (CNBC)

Given that forecast, I wouldn’t worry about the 5% fixed income YTW securing my pension liabilities. Instead, I’d worry about all the “growth” assets not used to secure the promises, as they will likely be struggling to even match the YTW on a CFM corporate bond portfolio.

What Will Their Performance be? Continued

By: Russ Kamp, Managing Director, Ryan ALM, Inc.

I recently published a post titled, “What Will Their Performance be in About 11 Years?” I compared the Ryan ALM, Inc. cash flow matching (CFM) strategy to a relative return fixed income manager, and I raised the question about future performance. Barring any defaults within the investment grade universe, which historically average about 2/1,000 bonds, we can tell you on day one of the portfolio’s construction what the performance will be for the entire period of a CFM mandate.

In my previous post, I stated, “now, let me ask you, do you think that a core fixed income manager running a relative return portfolio can lay claim to the same facts? Absolutely, not! They may have benefitted in the most recent short run due to falling interest rates, but that future performance would clearly depend on multiple decisions/factors, including the duration of the portfolio, changes in credit spreads, the shape of the yield curve, the allocation among corporates, Treasuries, agencies, and other bonds, etc. Let’s not discount the direction of future interest rate movements and the impact those changes may have on a bond strategy. In reality, the core fixed income manager has no idea how that portfolio will perform between now and March 31, 2035.

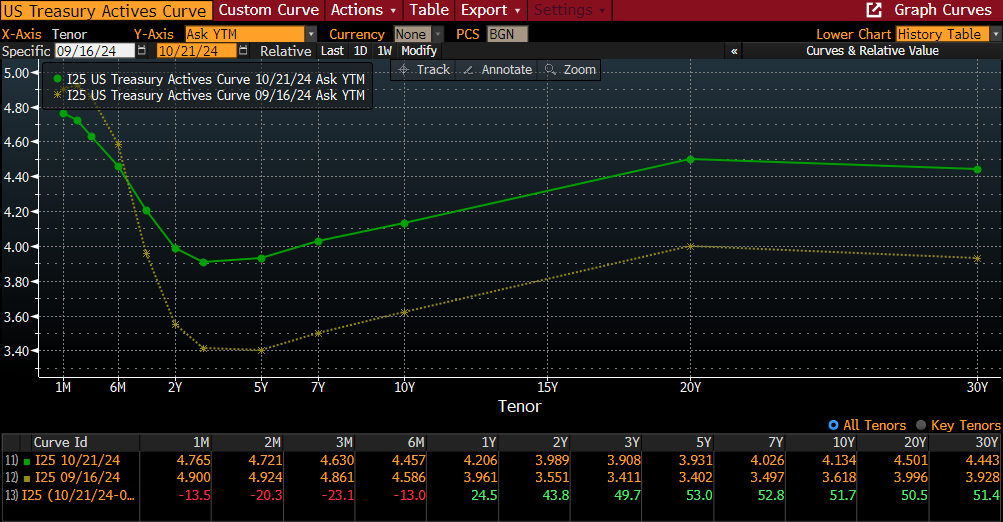
Whatever benefit the active relative-return fixed income manager might have gotten from those declining rates earlier this year has now been erased, as Treasury yields have risen rapidly across all maturities since the Fed announced its first cut in the FFR. Including today’s trading, the US 10-year Treasury note yield has backed up 67 bps since the yield bottomed out at 3.5% in mid-September (currently 4.17% at 11:40 am). The duration of the 10-year note is 8.18 years, as of this morning. That equates to a loss of principal of -5.48% in roughly 1 month. Wow!

Again, wouldn’t you want the certainty of a CFM portfolio instead of the very uncertain performance of the relative return fixed income manager? Especially when one realizes that the active fixed income manager’s portfolio won’t likely cover the liquidity needed to meet benefits and expenses. Having to “sell” bonds in a rising rate environment locks in losses for the active manager, while the CFM portfolio is designed to meet ALL of the liquidity through maturing principal and income – no selling. This seems like a no-brainer!

Milliman: Public Pension Funded Ratio at 82.8%

By: Russ Kamp, Managing Director, Ryan ALM, Inc.

Milliman recently released results for its Public Pension Funding Index (PPFI), which covers the nation’s 100 largest public defined benefit plans.

Positive equity market performance in September increased the Milliman 100 PPFI funded ratio from 82.0% at the end of August to 82.8% as of September 30, representing the highest level since March 31, 2022, prior to the Fed’s aggressive rate increases. The previous high-water mark stood at 82.7%. The improved funding for Milliman’s PPFI plans was driven by an estimated 1.4% aggregate return for September 2024 (9.4% for the YTD period). Total fund performance for these 100 public plans ranged from an estimated 0.7% to 2.1% for the month. As a result of the relatively strong performance, PPFI plans gained approximately $72 billion in MV during the latest month. The asset growth was offset by negative cash flow amounting to about $10 billion. It is estimated that the current asset shortfall relative to accrued liabilities is about $1.138 trillion as of September 30. 

In addition, it was reported that an additional 5 of the PPFI members had achieved a 90% or better funded status (34 plans have now eclipsed this level), while regrettably, 14 of the constituents remain at <60%. Given that changing US interest rates do not impact the calculation for pension liabilities under GASB accounting, which uses the ROA as the liability discount rate, the improvement in the collective funded status may be overstated, as US rates continued to decline throughout the third quarter following an upward trajectory to start the calendar year.

ARPA Update as of October 11, 2024

By: Russ Kamp, Ryan ALM, Inc.

I hope that you enjoyed a wonderful holiday weekend. Autumn’s beautiful colors are finally present in the Northeast – enjoy those, too. As you will soon read, the PBGC had a busy week according to its latest update, so the extra day of rest was likely necessary.

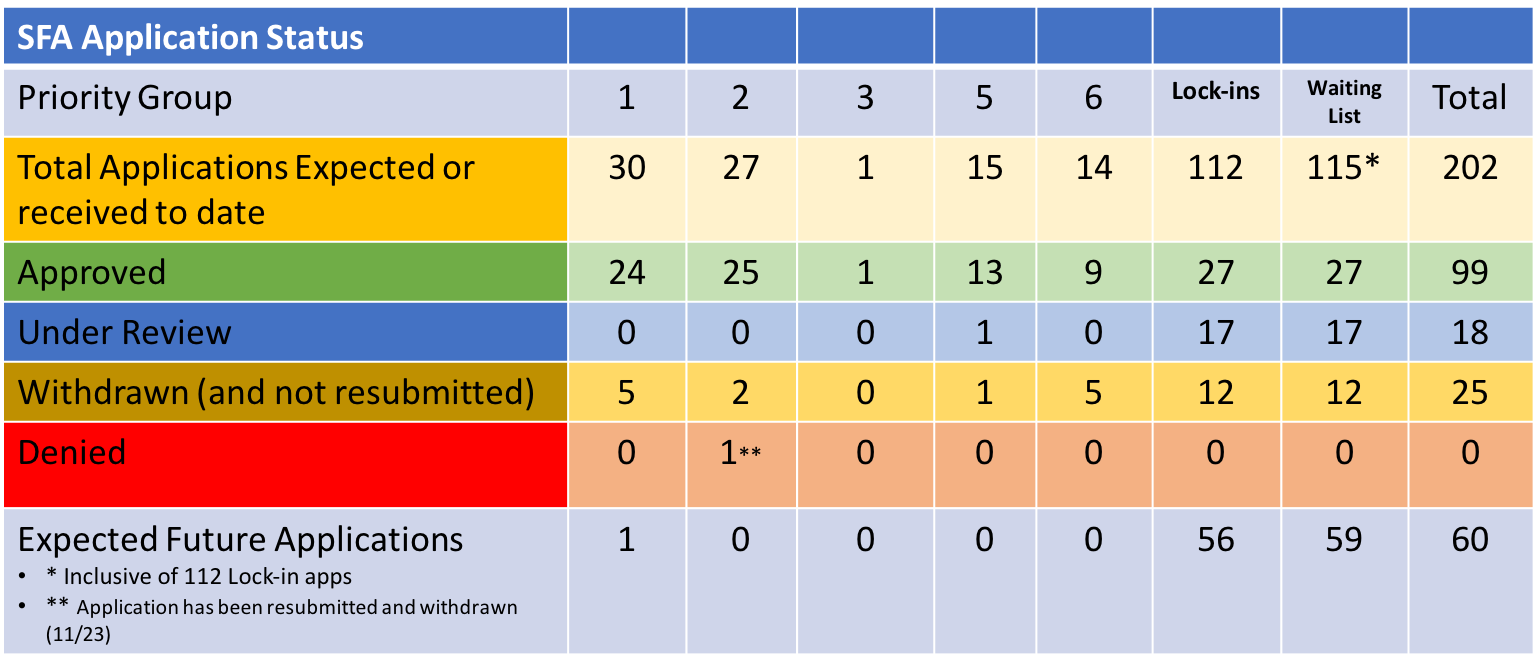
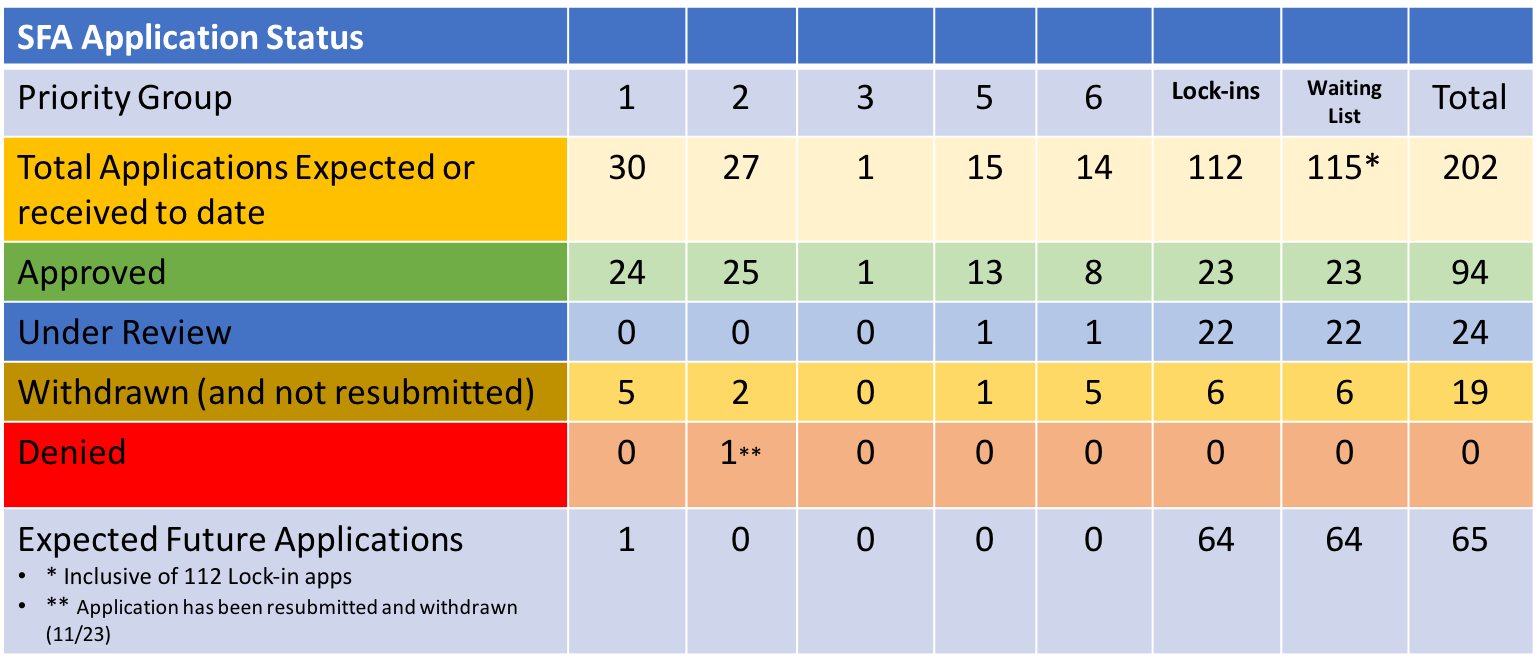
The PBGC’s effort implementing the ARPA legislation continues in full swing. During the prior week there were three new applications received, two approved, another 2 withdrawn, and finally there were two more plans rebating excess SFA as a result of census corrections. Thankfully, there were no applications rejected. Lastly, there were no multiemployer plans seeking to be added to the waitlist (non-Priority Group members).

The plans receiving approval included Midwestern Teamsters Pension Plan and the Carpenters Pension Trust Fund – Detroit & Vicinity. The Carpenters nailed a $635.0 million SFA grant for its 22,576 participants, while the much smaller Midwestern Teamsters plan received $23.6 for 615 members. The PBGC has now awarded $68.6 billion in SFA grants to 94 pension systems.

Sheet Metal Workers’ Local No. 40 Pension Plan, Warehouse Employees Union Local 169 and Employers Joint Pension Plan, and Local 111 Pension Plan were granted the opportunity to submit requests for SFA grants. In the case of Local 111, they submitted a revised application. They are collectively seeking $124,7 million for 6,193 plan members. Good luck! In other news, the Teamsters Local 210 Affiliated Pension Plan and Local 111 Pension Plan withdrew their initial applications. These two funds were seeking $137.3 million collectively.

Finally, Milk Industry Office Employees Pension Trust Fund and Local 805 Pension and Retirement Plan rebated excess SFA grant money as a result of a census audit that confirmed overpayment. The Milk Industry delivered $193k (2.4% of the SFA received) to the PBGC, while Local 805 forked over $3.2 million (1.8% of the grant). Both represented a larger percentage of the SFA received than the previous transactions. At this time, 21 plans have returned $147.5 million in SFA and interest representing 0.37% of the grants received.

I hope that you find these updates useful. I remain incredibly bullish regarding the ARPA legislation and the positive impact that it continues to have on the American worker that earned this pension promise. Please don’t hesitate to reach out to Ryan ALM with any questions related to the legislation and what should be done to secure the promised benefits with the SFA grant assets.

Ryan ALM, Inc. 3Q’24 Pension Monitor

By: Russ Kamp, Managing Director, Ryan ALM, Inc.

We are pleased to share with you the Ryan ALM, Inc. Q3’24 pension monitor. This quarterly report compares different liability growth rates (based on a 12-year average duration) versus the asset growth rate for public, multiemployer, and corporate funds based on the P&I asset allocation survey of the top 1,000 plans which is updated annually each November.

With regard to Q3’24, Public Pension funds (4.9%) outperformed Corporate Pension plans (3.6%) by 1.3% net of liability growth, as public pension plans had a much greater exposure to US equities (21.9%) versus Corporates (12.6%). The S&P 500 continues to produce exceptionally strong returns in this uncertain environment. From a liability standpoint, the ASC 715 discount rates (+4.6%) marginally trailed liability growth for both public and multiemployer plans that operate under GASB accounting rules using the ROA.

Please don’t hesitate to reach out to us with any questions that you might have regarding this monitor.

What Will Their Performance Be In About 11 years?

By: Russ Kamp, Managing Director, Ryan ALM, Inc.

How comforting would it be for both plan sponsors and their advisors to know how a particular strategy is going to perform over some defined period of time? I would think that having that knowledge would be quite comforting, at least as a “core” holding. Do you think that a core fixed income manager running a relative return strategy versus the Bloomberg Barclays Aggregate Index could tell you how that portfolio will perform in the next 10 1/2 years? No. Ryan ALM can with a very high degree of certainty. How’s that? Well, cash flow matching (CFM) of asset cash flows to liability cash flows locks in that relationship on the day that the portfolio is constructed. Ryan ALM views risk as the uncertainty of achieving the objective. If the true pension objective is to fund benefits and expenses in a cost-efficient manner with prudent risk, then our CFM model will be the lowest risk portfolio.

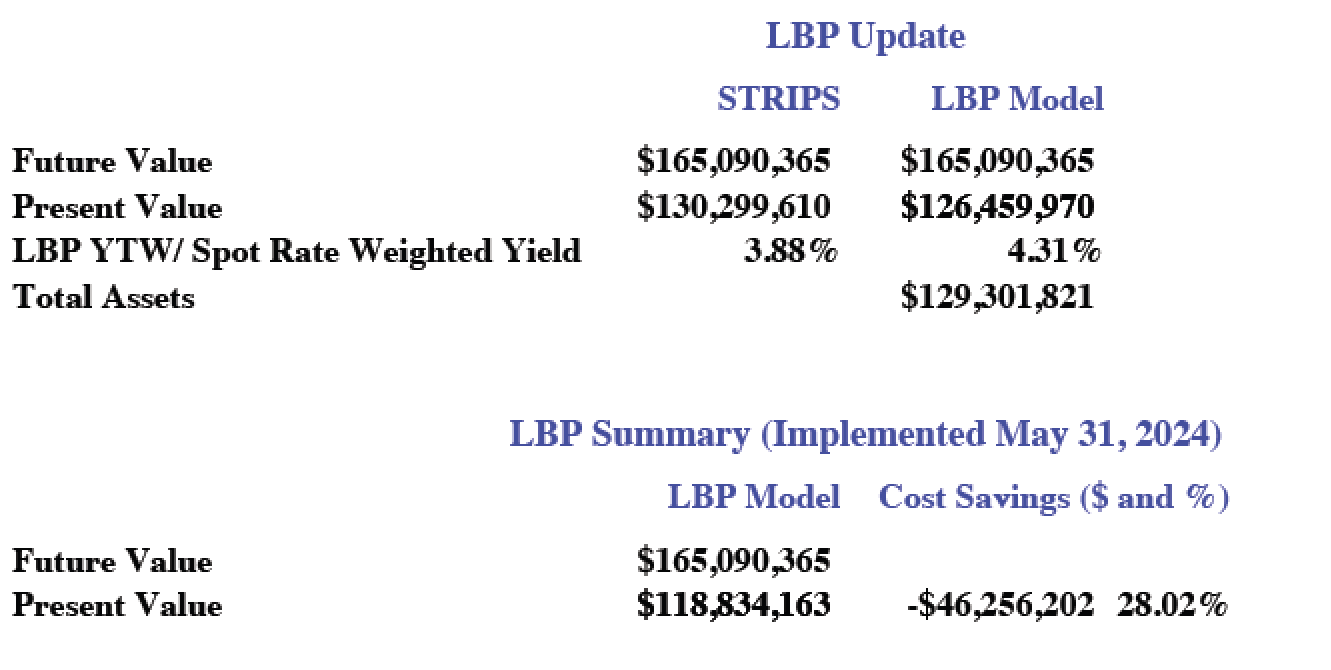
We were awarded a CFM assignment earlier this year. Our task was/is to defease the future grant payments for this foundation. On the day the portfolio was built, we were able to defease $165.1 million in FV grant payments for only $118.8 million, locking in savings (difference between FV and PV of the liability cash flows) of $46.3 million equal to 28.0% of those future grant payments. That’s fairly substantial. The YTM on that day was 5.19% and the duration was 5.92 years.

Earlier this week, we provided an update for the client through our monthly reporting. The current Liability Beta Portfolio (the name that we’ve given to our CFM optimization process) has the same FV of grant payments. On a market value basis, the portfolio is now worth $129 million, and the PV of those future grant payments is $126 million. But despite the change in market value due to falling interest rates, the cost savings are still -$46.3 million. The YTM has fallen to 4.31%, but that doesn’t change the initial relationship of asset cash flows to liability cash flows. That is the beauty of CFM.

Now, let me ask you, do you think that a core fixed income manager running a relative return portfolio can lay claim to the same facts? Absolutely, not! They may have benefitted in the most recent short run due to falling interest rates, but that would clearly depend on multiple decisions/factors, including the duration of the portfolio, changes in credit spreads, the shape of the yield curve, the allocation among corporates, Treasuries, agencies, and other bonds, etc. Let’s not discount the direction of future interest rate movements and the impact those changes may have on a bond strategy. In reality, the core fixed income manager has no idea how that portfolio will perform between now and March 31, 2035.

Furthermore, will they provide the necessary liquidity to meet those grant payments or benefits and expenses, if it were a DB pension? Not likely. With a yield to maturity of 4.31% and a market value of assets of $129.3 million, they will produce income of roughly $5.57 million/year. The first year’s grant payments are forecast to be $9.7 million. Our portfolio is designed to meet every $ of that grant payment. The relative return manager will be forced to liquidate a portion of their portfolio in order to meet all of the payments. What if rates have risen at that point. Forcing liquidity in that environment will result in locking in a loss. That’s not comforting.

CFM portfolios provide the client with the certainty of cash flows when they are needed. There is no forced selling, unlike the relative return manager that might be forced to sell in a market that isn’t conducive to trading. Furthermore, a CFM mandate locks in the cost savings on day 1. The assets not used to meet those FV payments, can now be managed more aggressively since they benefit from more time and aren’t going to be used to meet liability cash flows.

Asset allocation strategies should be adapted from a single basket approach to one that uses two baskets – liquidity and growth. The liquidity bucket will house a defeased bond portfolio to meet all the cash flow requirements and the remainder of the assets will migrate into the growth bucket where they can now grow unencumbered. You’ll know on day 1 how the CFM portfolio is going to perform. Now all you have to worry about are those growth assets, but you’ll have plenty of time to deal with any challenges presented.

ARPA Update as of September 27, 2024

By: Russ Kamp, Managing Director, Ryan ALM, Inc.

Welcome to the last update for September 2024. Let’s hope that today brings at least one Mets’ win in Atlanta. It would mark quite the turnaround from where this team was on June 1st.

With regard to the PBGC’s implementation of the ARPA legislation, the efiling portal still remains temporarily closed. As a result, new applications have not been forthcoming. There are presently 22 applications with the PBGC. Sixteen of those must be acted on by November 30th.

Activity was fairly limited during the past week. There were no applications approved or denied. There was one application withdrawn. Bricklayers Pension Fund of West Virginia withdrew the initial application seeking $1.2 million for the 170 plan participants. In addition, 3 funds repaid a portion of the SFA grant received. Mid-Jersey Trucking Industry and Teamsters Local 701 Pension and Annuity Fund, the Pension Plan of the Bakery Drivers and Salesmen Local 194 and Industry Pension Fund, and the Building Material Drivers Local 436 Pension Plan each returned a portion of the overfunding due to incorrect census data. In total, the three plans returned $2.7 million from the $348.3 million received in SFA or 0.78%. To date, 17 plans have returned $142.3 million or 0.36% of the grant monies received. Lastly, there were no additional plans seeking to be added to the waitlist, which remains at 68.

Please don’t hesitate to reach out to us with any questions that you might have regarding investment strategies for the SFA assets. We are always willing to model your plan’s forecasted cash flows so that various implementations can be reviewed.

Defined Benefit Pension Plan: “Absolute Truths”

By: Russ Kamp, Managing Director, Ryan ALM, Inc.

The four senior team members at Ryan ALM, Inc. have collectively more than 160 years of pension/investment experience. We’ve lived through an incredible array of markets during our tenures. We have also witnessed many attempts on the part of Pension America to try various strategies (schemes) to meet the promises that have been made to the pension plan participants. Regrettably, defined benefit (DB) pension plans continue to be tossed aside by corporate America in favor of defined contribution (DC) plans. Both public and multiemployer plan sponsors would be wise to adopt a strategy that seeks more certainty in order to protect and preserve these critically important retirement vehicles before they are subject to a similar fate.

We’ve compiled a list of DB pension “Absolute Truths” that we believe return the management of pension plans back to its roots when “SECURING the promised benefits at a reasonable cost and with prudent risk” was the primary objective. The dramatic move away from the securing of benefits to today’s arms race focus on the return on asset assumption (ROA) has eliminated any notion of certainty in favor of far greater variability in likely outcomes.

Here are the Ryan ALM DB Truths:

  • Defined Benefit (DB) plans are the best retirement vehicles!
  • They exist to fulfill a financial promise that has been made to the plan participant upon retirement.
  • The primary objective in managing a DB plan is to SECURE the promised benefits at a reasonable cost and with prudent risk.
  • The promised benefit payments are liabilities of the pension plan sponsor.
  • Liabilities need to be measured, monitored, and managed more than just once per year.
  • Liabilities are future value (FV) obligations – a $1,000 monthly benefit is $1,000 no matter what interest rates do. As a result, they are not interest rate sensitive.
  • Plan assets (stocks, bonds, real estate, etc.) are Present Value (PV) or market value (MV) calculations. We do not know the FV of assets except for bonds cash flows (interest and principal at maturity)
  • In order to measure and monitor the funded status, liabilities need to be converted from FV to PV – a Custom Liability Index (CLI) is absolutely needed.
  • A discount rate is used to create a PV for liabilities – ROA (publics), ASC 715 (corps), STRIPS, etc.
  • Liabilities are bond-like in nature. The PV of future liabilities rises and falls with changes in the discount rate (interest rates).
  • The nearly 40-year decline in US interest rates beginning in 1982 crushed pension funding, as the growth rate for future liabilities far exceeded the growth rate of the PV of assets.
  • The allocation of plan assets should be separated into two buckets – Liquidity (beta) and Growth (alpha).
  • The liquidity assets should consist of a bond portfolio that matches (defeases) asset cash flows with the plan’s liability cash flows (benefits and expenses (B&E)).
  • This task is best accomplished through a Cash Flow Matching (CFM) investment process.
  • The liquidity assets should be used to meet B&E chronologically buying time for the alpha assets to grow unencumbered in their quest to meet future liabilities.
  • The Growth assets will consist of all non-bonds, which can now grow unencumbered, as they are no longer a source of liquidity. Growth assets will fund future liabilities.
  • The Return on asset (ROA) assumption should be a calculated # derived through an Asset Exhaustion Test (AET)
  • The pension plan’s asset allocation should be responsive to the plan’s funded status and not the ROA.
  • As the funded status improves, port alpha (profits) from the Growth portfolio into the Liquidity bucket (de-risk) extending the cash flow matching assignment and securing more promises.
  • This de-risking ensures that plans don’t continue to ride the asset allocation rollercoaster leading to volatile contribution costs.
  • DB plans are a great recruiting and retention tool for managing a sponsor’s labor force.
  • DB plans need to be protected and preserved, as asking untrained individuals to fund, manage, and then disburse a “benefit” through a Defined Contribution plan is poor policy.
  • Unfortunately, doing the same thing over and over and… is not working. A return to pension basics is critical.

You’ve made a promise: measure it – monitor it – manage it – and SECURE it…   

Get off the pension funding rollercoaster – sleep well!

Must We Continue to Just Shift Deck Chairs on the Titanic?

By: Russ Kamp, Managing Director, Ryan ALM, Inc.

You may not have been following Ryan ALM’s blog through the many years that I have been producing posts in which I’ve touched on this subject. We at Ryan ALM continue to question the logic of focusing on the return on asset assumption (ROA) as the pension plan’s primary objective.  We especially challenge the notion that shifting a couple of percent from one asset class to another produces meaningful results for the pension system’s asset allocation and long-term funding success.

Day after day, I read, as I’m sure that you do, articles, blogs, emails, etc. highlighting a new product or twist to an existing one that will just “rock your world” and assist you on the road to achieving the return on asset (ROA) assumption. It doesn’t matter whether your plan is a public fund, multiemployer pension, or a private plan, the continued focus on the ROA as the primary objective for both plan sponsors and their asset consultants is leading everyone down the wrong path. You see, most of the retirement community has been sold a bag of rotten goods claiming that a plan needs to generate the ROA, or it will not meet its funding goals. I say, “Hogwash”! I’d actually like to say something else, but you get my drift.

So, when valuations for most asset classes seem to be stretched, as they do today, where does a pension plan go to allocate their plan’s assets? Well, this “issue” has plan sponsors once again scratching their collective heads and doing the Curly shuffle.  You see, they have once again through the presumed support of their consultants, begun to approach asset allocation as nothing more than rearranging the deck chairs on the Titanic.

Despite tremendous gains from both equity and fixed income bull markets, these plans are willing to “let it ride” instead of altering their approach to possibly reduce risk, stabilize the funded status, and moderate contribution expense. Can you believe that one of the country’s largest public plans has recently decided (I’m sure that it took a long time, too) to roll back fixed income exposure by 2% and equity exposure by 1% from 55% to 54%?  Are you kidding me? Is that truly meaningful or heroic?

Please note that generating a return commensurate with the ROA is not going to guarantee success. Furthermore, since most public pension plans are currently underfunded on an actuarial basis (let alone one based on market values) meeting this ROA objective will only further exacerbate the UAAL, as the funded status continues to slip. You see, if your plan is 80% funded, and that is the “average” funded ratio based on Milliman’s latest work, you need to outperform your plan’s 7% ROA objective by 1.75% in order to maintain the current funded status. Here’s a simple example as a proof statement:

Assets = $80   Liabilities = $100   ROA = 7.00%   Asset growth = $5.60   Liability growth = $7.00

In order for asset growth = $7.00, assets would need a 8.75% ROA

Given that reality, these plans don’t need the status quo approach that has been tried for decades. Real pension reform must be implemented before these plans are no longer sustainable, despite the claim that they are perpetual.  As an industry, we have an obligation to ensure the promised benefits are there when needed. Doing the same old, same old places our ability to meet this responsibility in jeopardy. If valuations are truly stretched, don’t leave your allocations basically stagnant. Take the opportunity to try something truly unique.

It is time to approach asset allocation with a renewed focus. Instead of having all of your plan’s assets tied to achieving the ROA, divide them into two buckets – liquidity and growth. The liquidity bucket will utilize a cash flow matching (CFM) strategy to ensure that monthly payments of benefits and expenses (B+E) are available, as needed, chronologically. The asset cash flows from the CFM strategy will be carefully matched against the liability cash flows of B+E providing the necessary liquidity. This provides the growth bucket (all non-bond assets) with an extended investing horizon, and we all know how important a long time horizon is for investing. Importantly, the growth assets will be used down the road to meet future pension liabilities and not in the short-term to meet liquidity needs. The practice of a cash sweep to meet ongoing liquidity has negatively impacted long-term returns for many pension systems.  Let bonds fund B+E so the growth assets can grow unencumbered.

Focusing on products and minor asset class shifts will waste a lot of your time and not produce the results that our pension plans need. Ensuring the appropriate funding to meet the promises given to the plan participant takes real reform. It starts with eliminating the single focus on the ROA. Pension plan liabilities need to be invited to the asset allocation dance, since paying a benefit is the only reason that the fund exists in the first place.

Liquidity Management Needs to be a Focus!

By: Russ Kamp, Managing Director, Ryan ALM, Inc.

I’ve produced several posts addressing the important issue of liquidity for pension plans. You may recall my 8/14/24 post titled “A Liquidity Crunch?” that referenced issues within private equity as a result of the lack of distributions or the March 28, 2024 post titled, “The Importance of Liquidity”, which referred to a terrific article penned by Jack Boyce. There have been several others, but the issue isn’t being addressed with the appropriate urgency, so I’ll continue to elevate our concerns. As we’ve stated many times, the only reason that a pension plan exists is because of promised benefits that have been made to the plan participant. It is that promise that must be met each and every month upon retirement. There are costs associated with meeting this commitment, so both the benefit and those expenses must be funded effectively and efficiently. At present, they are not!

Is the above picture representative of the available liquidity in your plan? Has the significant movement into alternatives reduced for you the number of investment strategies within your asset allocation framework that can provide liquidity when called upon? Is the changing shape (steepening) of the US Treasury yield curve reducing the return available on cash thus making the holding of cash reserves less palatable? Has your practice of doing a “cash sweep” of dividends, interest, and capital distributions each and every month created headaches for you?

We’d like to speak with you about a strategy – cash flow matching (CFM) – that can dramatically improve your liquidity, while enhancing the return associated with “cash reserves” thus reducing the potential negative impact on your pursuit of the required ROA. Wouldn’t you like liquidity to be abundant similar to the picture below? How comforting would it be to know that each and every month your plan has the necessary asset cashflows to meet the liability cashflows of benefits and expenses without having to liquidate assets that may be transacted at less than opportune times?

Cash flow matching (CFM) has been around for decades. CFM is often how insurance companies and lottery systems meet their future obligations. They take a present value calculation of that future promise and they fund an investment grade bond program that will carefully match asset cash flows with the liability cash flows so that your required liquidity is available monthly. There is no need to do a cash sweep! If you aren’t familiar with Guinness Global Investors (UK), they have determined through their research that the practice of sweeping dividends is harmful (very) to long-term equity returns. In fact, they found that on a 10-year rolling basis going back to 1940, that dividends contributed 47% of the total return. More starkly, on a 20-year rolling basis, that contribution escalates to 57% – wow! The ability to reinvest those dividends into potentially higher returning equities is quite powerful. A CFM strategy will enable your plan to eliminate the ill effects of the cash sweeping practice and allow growth assets to grow unencumbered.

At Ryan ALM, Inc., liquidity management has always been a focus of ours since all we do is provide asset cash flows through our CFM product to meet those pesky monthly obligations. Let us help you craft a “liquidity policy” that makes sense. Furthermore, through our Custom Liability Index (CLI) we will map for you the needed liquidity as far into the future as you want to fund. Lastly, we’ll construct an investment grade bond portfolio that will ensure the necessary asset cash flows are available monthly (barring any defaults, which are incredibly rare within the IG universe). This portfolio should be the core holding within your plan. All other assets now have seen the investing horizon extended since they are no longer a source of liquidity. As you know, time is a critical variable in the success or failure of an investment program. The more time that one has to invest, the higher the probability of success. We stand ready to assist you.