That Step Isn’t Necessary!

By: Russ Kamp, CEO, Ryan ALM, Inc

I recently stumbled over a brief article that touched on LDI. I’m always interested in absorbing everything that I can on this subject. I was particularly thrilled when the author stated, “since LDI was recognized as best practice for defined benefit (DB) plans…” – YES! I’m not sure where that proclamation came from, but I agree with the sentiments. The balance of that sentence read, “…sponsors have implemented investment strategies as a journey.”

The initial steps on this journey were for plan sponsors to “simply extend the duration of their fixed income using longer duration market-based benchmarks.” Clearly, the author is referencing duration matching strategies as the LDI product of choice during that phase. According to the author, the next phase in this LDI journey was the use of both credit and Treasuries to better align the portfolio with a plan’s liability risk profile.

Well, we are supposedly entering a third phase in this LDI journey given the improved funded status and “outsized” allocations to fixed income. The question they posed: “How do we diversify the growing fixed income allocation?” Their answer, add a host of non-traditional LDI fixed income products, including private debt and securitized products, to the toolkit to add further yield and return. No, no, and no!

As mentioned previously, funded status/ratios have improved dramatically. According to this report, corporate plans have a funded ratio of 111% at the end of 2024 based on their firm’s Pension Solutions Monitor. Given that level of funding, the only thing that these plans should be doing is engaging a cash flow matching (CFM) strategy to SECURE all the promises that have been given to the plan participants. You’ve WON the pension game. Congratulations! There is no reason for a third phase in the LDI journey. There likely wasn’t a need for the second phase, but that’s water over the dam.

We, at Ryan ALM, believe that CFM is a superior offering within the array of LDI strategies, as it not only provides the necessary liquidity to meet monthly liability cash flows, but it duration matches each and every month of an assignment. Ask us to CFM the next 10 years, we will have 120 duration matches. Most duration matching strategies use either an average duration or a few key rates along the yield curve. Since duration is price sensitive, it changes constantly.  In addition, yield curves do not move in parallel shifts making the management of duration a difficult target.

With CFM you can use STRIPS, Treasuries, investment grade corporates or a combination of these highly liquid assets. You don’t need to introduce less liquid and more complex products. A CFM strategy is all you need to accomplish the pension objective. A CFM strategy provides certainty of the cash flows which is a critical and necessary feature to fully fund liabilities. This feature does not exist in private debt and securitized products. As a reminder, the pension objective is not a return target. It is the securing of the promised benefits at a reasonable cost and with prudent risk. Don’t risk what you’ve achieved. Lock in your funded status and secure the benefits. This strategy is designed as a “sleep well at night” offering. I think that you deserve to sleep like a baby!
Hey, Pension Community – We Have Liftoff!

By: Russ Kamp, CEO, Ryan ALM, Inc.

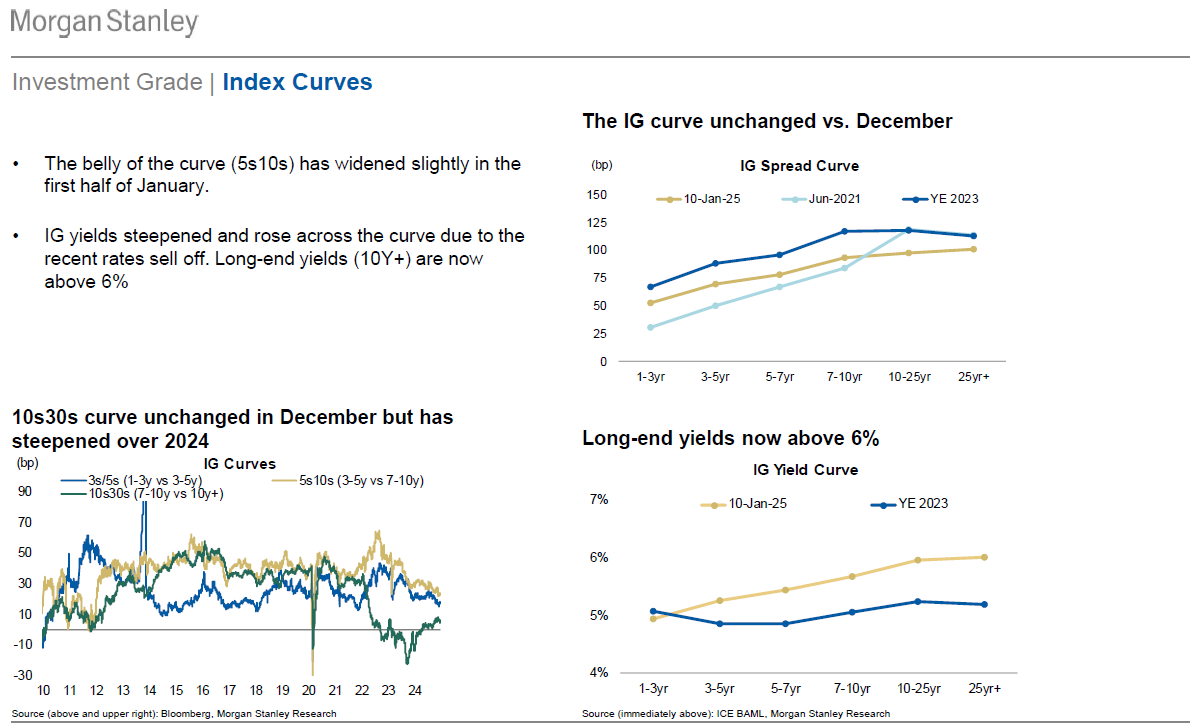
Not since October of 2023 have we seen long-dated Treasury yields at these levels. Currently, the 30-year Treasury bond yield is 5% (12:47 pm EST) and the 10-year Treasury Note’s yield has eclipsed 4.8%. Despite tight credit spreads, long-dated (25+ years) IG corporate bond yields are above 6% today (chart in the lower right corner).

Securing pension liabilities, whether your DB plan is private, public, or a multiemployer plan, should be the primary objective. All the better if that securing (defeasement strategy) can be accomplished at a reasonable cost and with prudent risk. The good news: the current rate environment is providing plan sponsors with a wonderful opportunity to accomplish all of those goals, whether you engage in a cash flow matching (CFM) for a relatively short period (5-years), intermediate, (10ish-years) or longer-term (15- or more years) your portfolio of IG corporate bonds will produce a YTM of > 5.5%. This represents a significant percentage of the target ROA.

Furthermore, as we’ve explained, pension liabilities are future values (FVs), and FVs are not interest rate sensitive. Your portfolio will lock in the cost savings on day one, and barring any defaults (about 2/1,000 in IG bonds), the YTM is what your portfolio will earn throughout the relationship. That is exciting given the fact that traditional fixed income core mandates bleed performance during rising rate regimes. In fact, the IG index is already off 1.2% YTD (<10 trading days).

Who knows when the high equity valuations will finally lead to a repricing. Furthermore, who knows if US inflation will continue to be sticky, the Fed will raise or lower rates, geopolitical risks will escalate, and on and on. With CFM one doesn’t need a crystal ball. You can SECURE the promised benefits for a portion of your portfolio and in the process you’d be stabilizing the funded status and contribution expenses associated with those assets. Don’t let this incredibly attractive rate environment come and go without doing anything. We saw inertia keep plans from issuing POBs when rates were historically low. It is time to act.

Corporate Funding Improved Significantly in 2024!

By: Russ Kamp, CEO, Ryan ALM, Inc.

Milliman is out with the year-end report on corporate pension funding and it tells a beautiful story. The Milliman 100 Pension Funding Index (PFI), is reporting an average 105% funded ratio at the end of 2024 compared to 99.5% at the end of 2023. But wait, assets for the top 100 plans only grew by 4.2%, which must have been below the stated ROA. Furthermore, total assets declined by $26 billion after accounting for benefits and expenses. How is that possible? Oh, I get it, the growth in liabilities matters.

Milliman is reporting that the discount rate used to value corporate pension liabilities increased 59 bps during the year from 5.0% at 12/31/23 to 5.59% as of year-end 2024. That significant move up in rates drove the present value of those pesky liabilities down by -$94 billion creating a $68 billion improvement in the asset/liability relationship and a significantly improved funded ratio! Congrats corporate America and the participants that you serve!

I was recently asked by an industry reporter if the “underperformance” of corporate plans versus other sponsoring groups – public and multiemployer – should be a concern. I, of course said NO, that managing a DB plan is all about the relationship of assets to liabilities. Both could have negative or positive growth rates, but if asset growth exceeds liability growth the plan wins! It is really a simple concept.

Now, I would suggest that corporate America get even more conservative at this time, as we live in an environment of stretched valuations, stubborn inflation, the prospect of higher rates, etc. Congrats on your collective victory. Secure those promises through a cash flow matching (CFM) strategy that will not only provide you with the security that the benefits are protected, but the enhanced liquidity and lengthened investing horizon for any residual growth assets will also be realized.

As always, thanks to Zorast Wadia and the Milliman organization for taking the time to produce this important analysis. Without good data, it is difficult to know how to play the game – assets versus liabilities is the name of the pension game!

Will You Do Nothing?

By: Russ Kamp, CEO, Ryan ALM, Inc.

I recently read an article by Cliff Asness of AQR fame, titled “2035: An Allocator Looks Back over the Last 10 Years”. It was written from the perspective that performance for world markets was poor and his “fund’s” performance abysmal during that 10-year timeframe. His take-away: we can always learn from our mistakes, but do we? He cited some examples of where he and his team might have made “mistakes”, including:

Public equity – “It turns out that investing in U.S. equities at a CAPE in the high 30s yet again turned out to be a disappointing exercise”.

Bonds – “Inflation proved inertial” running at 3-4% for the decade producing lower real returns relative to the long-term averages.

International equities – “After being left for dead by so many U.S. investors, the global stock market did better with non-U.S. stocks actually outperforming”.

Private equity – “It turned out that levered equities are still equities even if you only occasionally tell your investors their prices”. When everyone is engaged in pursuing the same kind of investment there is a cost.

Private credit – “The final blow was when it turned out that private credit, the new darling of 2025, was just akin to really high fee public credit” Have we learned nothing from our prior CDO debacle?

Crypto – “We had thought it quite silly that just leaving computers running for a really long time created something of value”. “But when Bitcoin hit $100k we realized that we missed out on the next BIG THING” (my emphasis) “Today, 10 after our first allocation and 9 years after we doubled up, Bitcoin is at about $10,000.”

Asness also commented on active management, liquid alts, and hedge funds. His conclusion was that “the only upside of tough times is we can learn from them. Here is to a better 2035-2045”

Fortunately, you reside in the year 2025, a year in which U.S. equities are incredibly expensive, U.S. inflation may not be tamed, U.S. bonds will likely underperform as interest rates rise, the incredible push into both private equity and credit will overwhelm future returns, and let’s not discuss cryptos, which I still don’t get. Question: Are you going to maintain the status quo, or will you act to reduce these risks NOW before you are writing your own 10 year look back on a devastating market environment that has set your fund back decades?

As we preach at Ryan ALM, Inc., the primary objective when managing a DB pension plan is to SECURE the promised benefits at a reasonable cost and with prudent risk. Continuing to invest today in many segments of our capital markets don’t meet the standard of low cost or of a prudent nature. Now is the time to act! It really doesn’t necessitate being a rocket scientist. Valuations matter, liquidity is critical, high costs erode returns, and no market outperforms always! Take risk off the table, buy time for the growth assets to wade through the next 10-years of choppy markets, and SECURE the promised benefits through a cash flow matching (CFM) strategy that ensures (barring defaults) that the promised benefits will be paid when due.

Thanks, Cliff, for an excellent article!

Is Now The Time To Act?

By: Russ Kamp, Managing Director, Ryan ALM, Inc.

Equity market participants were recently reminded of the fact that markets can fall, and unfortunately they usually don’t decline with any kind of notice. The impetus behind the markets’ most recent challenging day was the Fed’s relatively tame forecast for likely interest rate moves in 2025. There is no question in my mind that the nearly 4-decade decline in rates from lofty heights achieved in the early ’80s, when the Fed Funds Rate eclipsed 20%, to the covid-fueled bottom reached in early 2020, when the yield on the 10-year Treasury Note was at 0.5%, made bond returns a lot stronger than anyone’s forecast.

It certainly seemed that the US Federal Reserve provided the security blanket any time there was a wobble in the markets. This action allowed “investors” to keep their collective foot on the gas with little fear. Sure, there were major corrections during that lengthy period, but the Fed was always there to lend a hand and a ton of stimulus that propped up the economy and markets, and ultimately the investment community. As we saw in 2022, the Fed had run out of dry powder and ultimately had to raise US interest rates to stem a vicious inflationary spike. Rates rose rather dramatically, and the result was an equity market, as measured by the S&P 500, that declined 18% for the calendar year. Bonds faired only marginally better as rising rates impacted bond principals creating a collective -12.1% return for the BB Aggregate Index.

As we enter 2025, do we once again have a situation in which the Fed’s ability to reduce rates has been curtailed due to a stronger economy than anticipated? Will the continued strength and massive government stimulus drive inflation and rates higher? According to a blog post from Apollo’c CIO, here are his list of the potential risks and the probabilities:

Risks to global markets in 2025

Interesting that he feels, like we do at Ryan ALM, Inc., that the economy is likely to be stronger than most suspect (#6) leading to higher inflation, rising rates (#7), and a 10-year Treasury Note yield in excess of 5% (#8). That yield is currently at 4.6% (as of 3:06 pm).

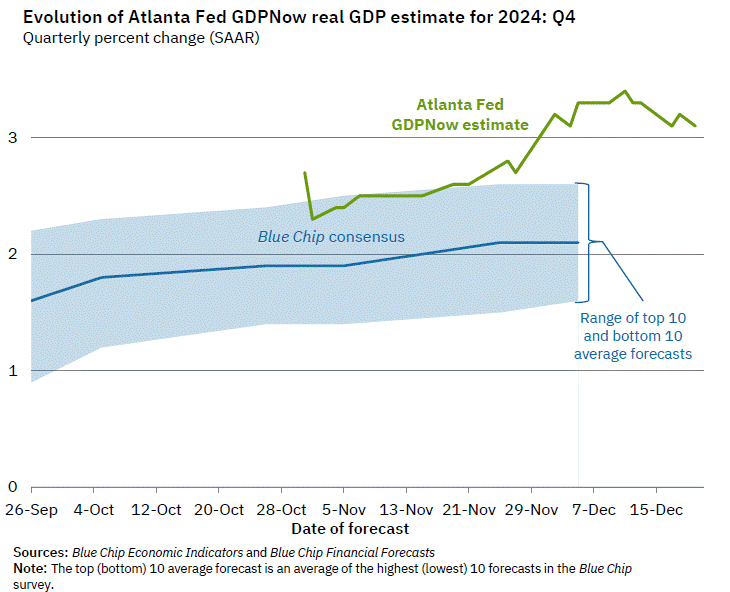
For those that might be skeptical, the Atlanta Fed’s GDPNow model is currently forecasting GDP growth for Q4’24 at 3.1% annualized. They have done a wonderful job forecasting quarterly growth rates. Their forecasts have consistently been above the “street’s” and as a result, much more accurate.

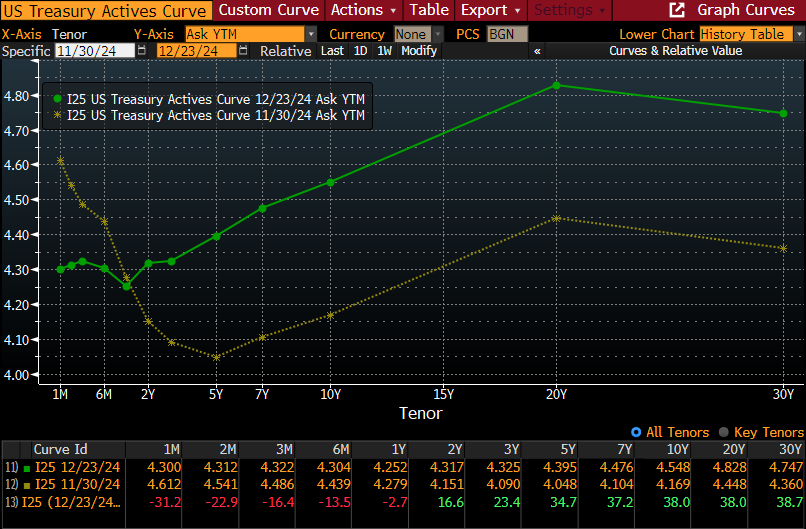
In addition, despite the third rate cut by the Federal Reserve at the most recent FOMC meeting of their benchmark Fed Funds Rate (-1.0% since the easing began), interest rates on longer dated maturities have risen quite significantly, as reflected below.

Rising US rates, stronger growth, and greater inflation may just be the formula for a significant contraction in equity valuations, especially given the current level. Be proactive. Reduce risk. Secure the promised benefits. Under no circumstance should you just let your “winnings” ride.

How Comforting is $1,305.54/year?

By: Russ Kamp, Managing Director, Ryan ALM, Inc.

One doesn’t have to spend much time on LinkedIn.com these days without seeing a discussion about the pros and cons of Defined Benefit (DB) vs. Defined Contribution (DC) aka 401(k) plans. Anyone who has read just a few of the >1,500+ posts on this blog know that I and Ryan ALM, Inc. are huge supporters of DB plans. Based on the following, it becomes apparent why that is the case.

One topic frequently mentioned among our peers is financial literacy. As a former member of two boards of education (11 years in total), I have witnessed first-hand how little financial literacy is shared with our high school students, especially as it relates to saving and investing. That said, as important as education is, the greatest issue for me is the lack of disposable income for the average American worker.

Frequently we read about the spending habits of younger generations, including being the “avocado toast” crowd. Examples often used include the daily purchase of a Starbucks drink or two, the use of Uber Eats, and similar examples of perceived wasteful spending. They fail to mention that even “well-paid” workers (>$100k) are burdened by a mortgage or rent payment, they likely have student loan debt, they have to buy insurance in order to use their car, which is also a very expensive purchase, they are required to have health insurance, homeowners or rental insurance, and God forbid that they have a spouse and a couple of kids. Childcare expenses have gotten to be insane. Is there any wonder that funding one’s own retirement has proven to be incredibly challenging?

So how are we doing? Unfortunately, most of the literature on the subject uses average balances to represent 401(k) savings. This practice needs to stop. According to Vanguard the average balance in 2024 is $134,128, but the median balance is $35,285. In addition, Morningstar has just published an article stating that retirees should use only a 3.7% withdrawal rate (no longer 4%) to safely use a 401(k) retirement balance given the recent performance of equity markets and the current interest rate environment. Let’s see: 3.7% * $35,285 = $1,305.54. That is an annual withdrawal, although it looks like it should be a monthly payout! What kind of retirement will that level of annual withdrawals provide? For comparison purposes, the average DB payout in the private sector is $11k and nearly $25k in public pensions.

As a reminder, DC plans were intended to be supplemental to DB plans. It is highly regrettable that they have morphed into most everyone’s primary means of “accumulating” retirement resources. This migration in proving to be an unmitigated failure and the consequences will be untenable. The American worker needs access to a DB plan. Let’s work together to protect and preserve those that remain, while encouraging former sponsors of these plans to rethink the decision to freeze or terminate. There are also state sponsored entities that afford employees in smaller companies access to a DB-like plan. That said, please manage them with a focus on the pension promise (securing benefits). Don’t rely on markets and all the volatility that comes with that exposure to “fund” these essential programs. That strategy hasn’t worked!

“Peace of Mind” – How Beneficial Would That Be?

By: Russ Kamp, Managing Director, Ryan ALM, Inc.

As a member of the investment community do you often feel stressed, worried, insecure, uneasy, or are you just simply too busy to be at peace? In the chaotic world of pension management, finding peace of mind can sometimes be hard, if not impossible. How much would it mean to you if you could identify an investment strategy that provides you with just that state of being?

At Ryan ALM, Inc. our mission is to protect and preserve DB pension plans through a cash flow matching (CFM) strategy that ensures, barring any defaults, that the liabilities (benefits and expenses) that YOU choose to cover are absolutely secured chronologically. You’ll have the liquidity to meet those obligations in the amounts and at the time that they are to be used. There is no longer the worry and frustration about finding the necessary “cash” to meet those promises. CFM provides you with that liquidity and certainty of cash flows.

Furthermore, you are buying time for the growth (alpha or non-bond) assets to now grow unencumbered, as they are no longer a source of liquidity. You don’t have to worry about drawdowns, as the CFM portfolio creates a bridge over the challenging markets with no fear of locking in losses due to cash flow needs. Don’t you just feel yourself nodding off with the knowledge that there is a way to get a better night’s sleep?

How much would you “spend” to achieve such peace of mind? Most pension systems cobble together disparate asset classes and products, many which come with hefty price tags, in the HOPE of achieving the desired outcome. With CFM, YOU choose the coverage period to be defeased, which could be as short as 3-5 years or as long as it takes to cover the last liability. The longer the time horizon the greater the potential cost reduction. As an FYI, most of our clients have chosen a coverage period of roughly 10-years. Knowing that you have SECURED your plan’s obligations for the next 10-years, and locked in the cost reduction, which can be substantial (2% per year = 20% for 1-10 years), on the very first day in which the portfolio is constructed, has to be just an incredible feeling compared to living in an environment in which traditional pension asset allocations can have significant annual volatility and no certainty of providing either the desired return or cash flow when needed.

Remember, the amount of peace of mind is driven by your decisions. If you desire abundant restful nights, use CFM for longer timeframes. If you believe that you only need “peace of mind” in the near-term, engage a CFM strategy for a shorter 3-5 years. In any case, I guarantee that the pension plan’s exposure to CFM won’t be the reason why you are restless when you put your head on the pillow. Oh, and by the way, we offer the CFM strategy at fee rates that are substantially below traditional fixed income strategies, let alone, non-bond capabilities. Call us. We want to be your sleep doctor!

Another Example of the Games That Are Played

By: Russ Kamp, Managing Director, Ryan ALM, Inc.

I continue to be involved in programs associated with the Florida Public Pension Trustees Association (FPPTA) for which I remain quite grateful. If you’ve been exposed to their conferences, you know that they do a terrific job of bringing critical education to Florida’s trustee community and have since its founding in 1984. I’m pleased to highlight an expansion of their program to include the Trustee Leadership Council (TLC). This program brings together a small collection of experienced trustees who want to delve more deeply into the workings of defined benefit pensions – both assets and liabilities. Furthermore, the instruction is mostly done through case studies that provide them with the opportunity to roll up their sleeves and really get into the nitty gritty of pension management. Great stuff!

I could go on for days about the FPPTA and their programming, but I want to raise another issue. During a recent conversation with the TLC leadership, information was shared from one particular case study (a non-Florida-based pension plan). This information was for a substantial public pension plan that has had a troubling past from a funding standpoint. We also had info shared from a much smaller Florida-based system. There appeared to be a stark difference in performance of these two systems, as measured by the funded ratios, with a particular focus on 2022’s results. Upon further review, the one actuarial report used a 10-year smoothing for the funded ratio, while the Florida plan highlighted the performance for just 2022 and the impact that had on that plan’s funded ratio. As you can imagine, given the very challenging return environment in 2022, funded ratios took a hit. Question answered!

However, in looking at the actuarial report for the larger system, I saw that 2023’s funded ratio dramatically improved from the depths of 2022’s hit. It seemed outsized given what I knew about the environment that year. Diving a little deeper into the report – is there anything drier than an actuarial report – I found information related to a change in the discount rate that had occurred during 2023. It seems that this system had come up with its own funding method, but that was going to lead to the system becoming insolvent relatively soon. As a result, they passed legislation mandating that future contributions were going to be determined on an actuarial basis. How novel!

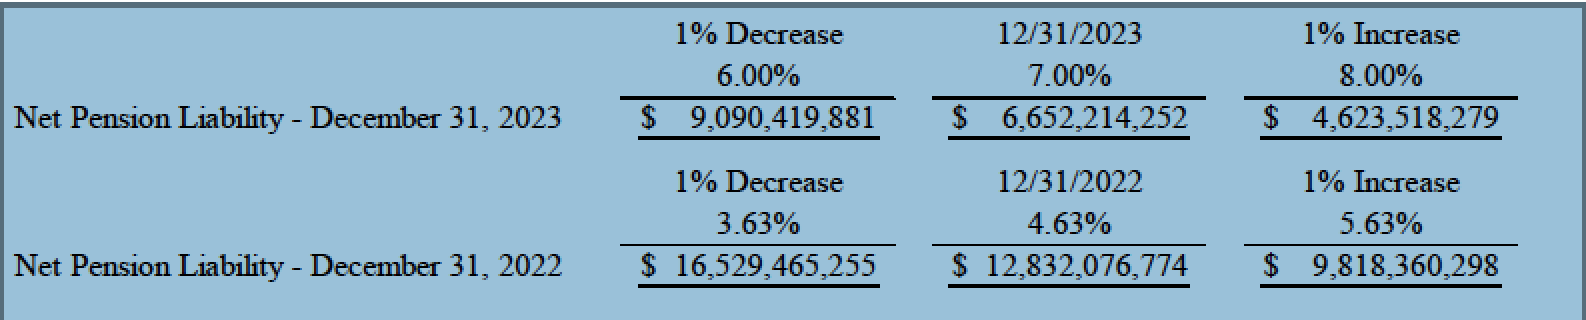
As a result of the move from a 4.63% blended rate (used a combination of the ROA (7%) and a municipal rate) they have now adopted a straight 7% discount rate equivalent to the fund’s return on asset assumption. Here is the result of that action:

As one can see, the present value (PV) of those future promises based on a 4.63% blended rate creates a net pension liability of -$12.8 billion. Using a 7% discount rate creates a PV of those net liabilities of “only ” -$6.7 billion. The dramatic improvement in the funded status from 48.4% to 64.1% is primarily the result of changing the discount rate, as a higher rate reduces the PV of your promise to plan participants. It really doesn’t change the promise, just how you are accounting for it.

The trustees who will participate in the TLC program offered by the FPPTA will receive a wonderful education that will allow them to dive into issues as referenced above. Knowing the ins and outs of pension management and finance will lead to more appropriate decisions related to benefits, contributions, asset allocation, etc.

And So It Is!

By: Russ Kamp, Managing Director, Ryan ALM, Inc.

Milliman has released the results for its Public Pension Funding Index (PPFI), which analyzes data from the nation’s 100 largest public defined benefit plans. They are reporting that the collective funded ratio deteriorated during the last month from 82.8% as of September 30th, to 81.2% as of October 31st, as the combined investments of these plans fell for the first time since April. The estimated return for the PFFI was -1.6%, as losses ranged from -2.9% to -0.6%. The $s lost were roughly $80 billion during the month. The funding deficit now stands at about $1.1 trillion.

You may recall that on November 8th, I produced a blog post titled, “Another Inconsistency”, in which I wrote about Milliman’s reporting of its corporate index that highlighted the fact that the collective funded ratio improved during the month despite asset losses due to the fact that liabilities fell to a great extent as interest rates rose.

I also wrote the following, “what do you think will happen in public fund land? Well, given weak markets, asset levels for Milliman’s public fund index will likely fall” (they did, as reported above). “Given that the discount rate for public pension systems is the ROA, there will be no change in the present value of public pension plans’ future benefit obligations (silly). As a result, instead of witnessing an improvement in the collective funded status of public pensions, we will witness a deterioration.” (and we did!) The inconsistency is startling!

Decisions with regards to benefits and contributions are made all the time based on information related to the funded ratio/status of these pension plans. Using different accounting standards clearly produces different outcomes that might just lead to inappropriate conclusions and the subsequent decisions. Oh, boy!

It Doesn’t Have to be This Way

By: Russ Kamp, Managing Director, Ryan ALM, Inc.

The Financial Times (FT) recently published an article highlighting the struggles of Ivy League schools trying to manage liquidity in the face of an extended downturn in the performance of private markets. Collectively, this august group of institutions continues to underperform the average return for higher education endowments of 10.3% for fiscal year 2024, with only 6 of 8 universities outperforming. This follows an even more challenging fiscal 2023 in which all 8 universities failed to top that year’s 6.8% average return. This difficult period in which distributions have dried up considerably, is forcing some, including Princeton, to issue bonds in order to support the operations of the schools. Haven’t we seen this story play out before?

Despite the troubles, there seems to be this reluctance to alter a strategy first adopted nearly four decades ago when Yale began to invest heavily in these strategies. In the article, Roger Vincent, former head of private equity at Cornell University said, “Everybody still believes in having as big an allocation to private equity as possible.” Really? Why? No asset class will always outperform. The problem with private equity at this time is the fact that too much money has chased to few quality deals driving up the costs of acquisition and lowering future returns. In the process, managers have become reluctant to reduce valuations in order to sell these portfolio companies which has crushed liquidity.

As I’ve written on many occasions, assets shouldn’t be lumped into one bucket focused on return either to meet benefit payments, or in this case, a spending policy. There should be two buckets – liquidity and growth. If the Ivies had structured their portfolios with this design in mind, they would have had sufficient liquidity when needed and issuing bonds wouldn’t have been necessary. Endowments and foundations would be well-served to adopt this structure. Liquidity can be managed through a cash flow matching (CFM) process, which will ensure (barring any defaults) that the cash will be on hand monthly, quarterly, and/or annually depending on the needs of the organization.

I’ve witnessed too many times throughout my 40+ year career investment ideas that got overwhelmed by cash flows. We’ve had booms and busts in real estate, equities (Dot Com era), quantitatively managed equities, gold/commodities, emerging markets, Japan, hedge funds, and on and on and… Why would “investors” believe that private equity would be immune to such action? Again, if an investment is deemed to be all weather, money will naturally flow to that “opportunity” thus reducing future prospects. One way to minimize the short-term impact of these cycles is to build in a liquidity strategy that bridges these troubled times.