That’s comforting!

By: Russ Kamp, Managing Director, Ryan ALM, Inc.

The Fed’s meeting notes from the September 17-18 FOMC have recently been released. Here are a few tidbits:

Some officials warned against lowering rates “too late or too little” because this risked harming the labor market.

At the same time, other officials said cutting “too soon or too much” might stall or reverse progress on inflation.

Here’s my favorite:

Officials also don’t seem in agreement over how much downward pressure the current level of the Fed’s benchmark rate was putting on demand.

I have an idea, why don’t we just have each member of the Federal Reserve’s board of governors stick their finger in the air and see which way the economic winds are blowing. It may be just as effective as what we currently seem to be getting.

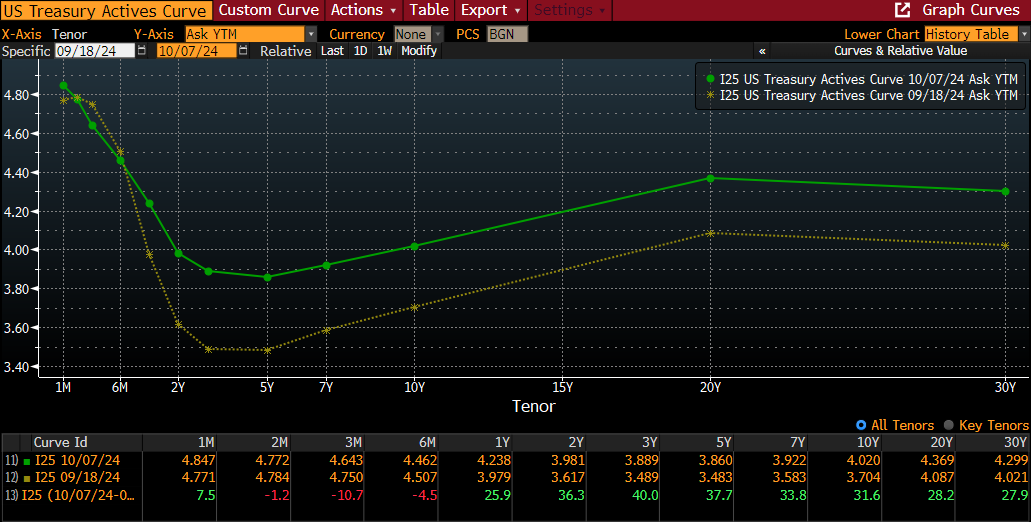
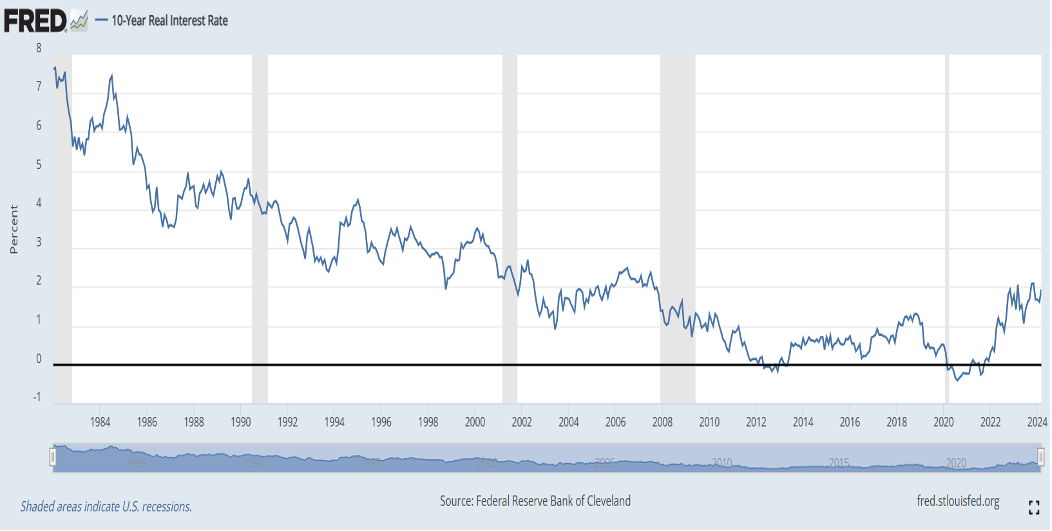
Given that the economy continues to hum along with annual GDP growth of roughly 3% and “full employment” at 4.1%, I’d suggest that having a Fed Funds Rate at 5.25%-5.50% wasn’t too constraining, if constraining at all. We’ve highlighted in this blog on many occasions the fact that US rates had been historically higher for extended periods in which both the economy and markets (equities) performed exceptionally well – see the 1990’s as one example.

Furthermore, as we’ve also highlighted, there is a conflict between current fiscal and monetary policy, as the fiscal 2024 federal deficit came in at $1.8 trillion or about $400 billion greater than the anticipated deficit at the beginning of the year. That $400 billion is significant extra stimulus that leads directly to greater demand for goods and services. How likely is it that the fiscal deficit for 2025 will be any smaller?

I believe that there are many more uncertainties that could lead to higher inflation. The geopolitical risks that reside on multiple fronts seem to have been buried at this time. Any one of those conflicts – Russia/Ukraine, Israel/rest of the Middle East, and China/Taiwan – could produce inflationary pressures, even if it just results in the US increasing the federal budget deficit to support our allies.

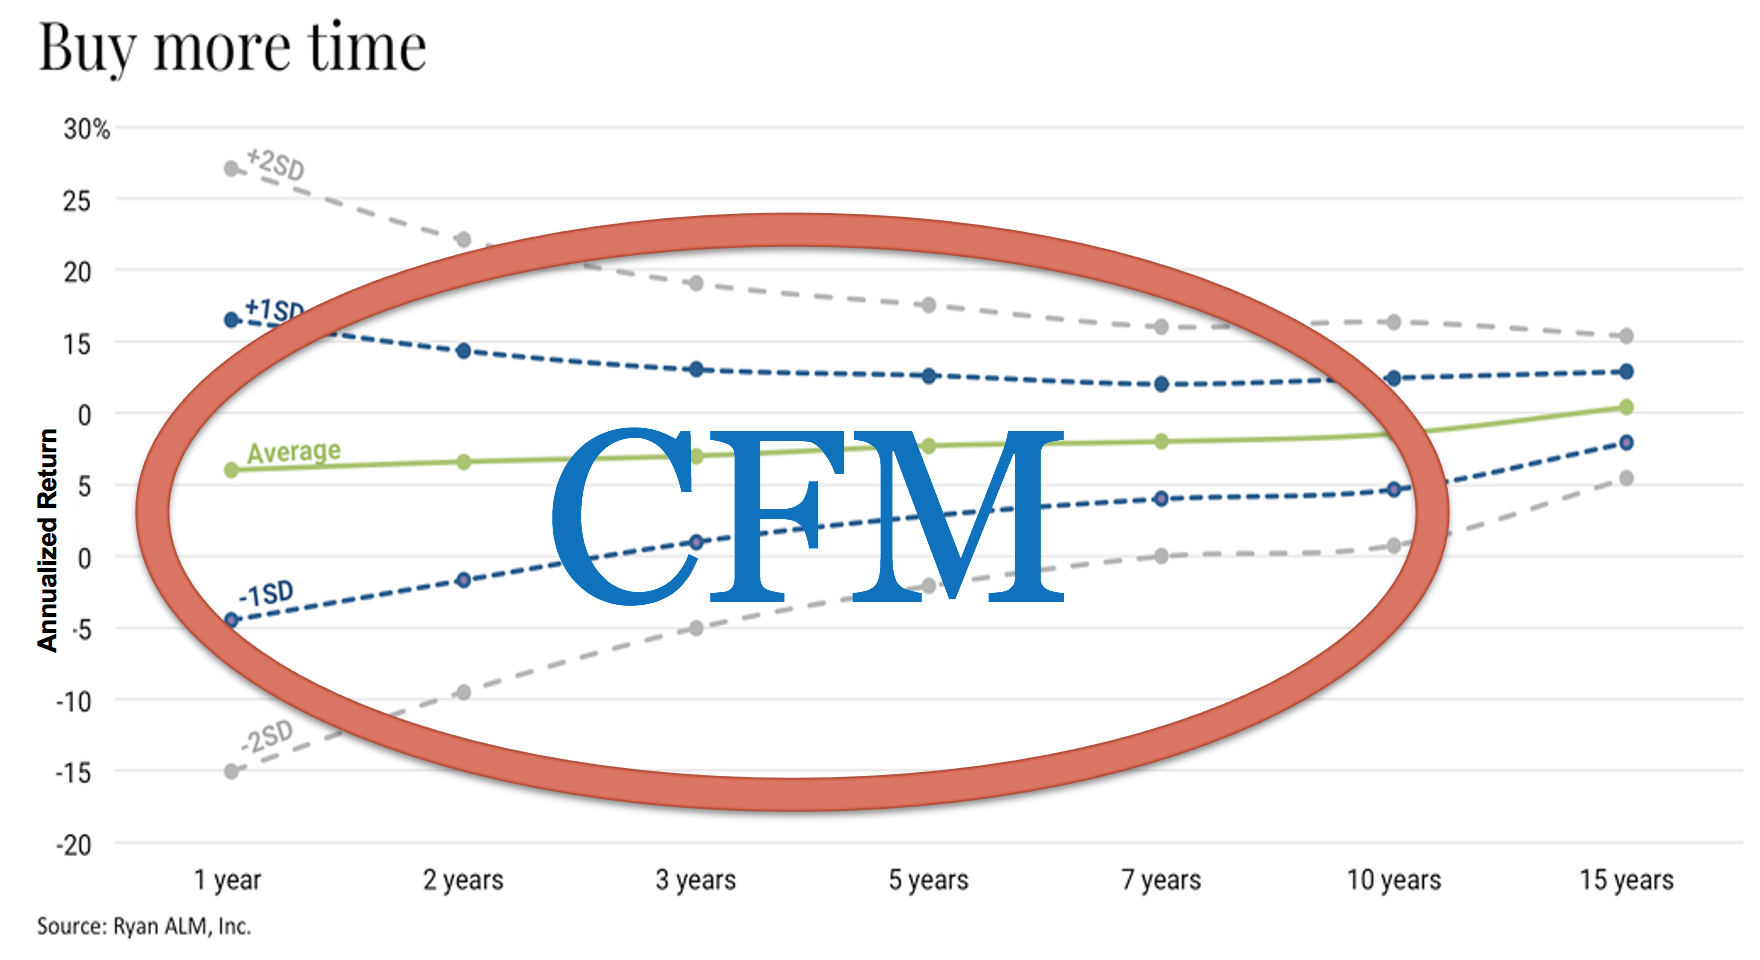
If just sticking one’s finger in the air doesn’t help us solve our current confusion, there is always this strategy:

We Suggested That It Might Just Be Overbought

By: Russ Kamp, Managing Director, Ryan ALM, Inc.

Regular readers of this blog might recall that on September 5th we produced a post titled, “Overbought?” that suggested that bond investors had gotten ahead of themselves in anticipation of the Fed’s likely next move in rates. At that time, we highlighted that rates had moved rather dramatically already without any action by the Fed. Since May 31, 2024, US Treasury yields for both 2-year and 3-year maturities had fallen by >0.9% to 9/5. By almost any measure, US rates were not high based on long-term averages or restrictive.

Sure, relative to the historically low rates during Covid, US interest rates appeared inflated, but as I’ve pointed out in previous posts, in the decade of the 1990s, the average 10-year Treasury note yield was 6.52% ranging from a peak of 8.06% at the end of 1990 to a low of 4.65% in 1998. I mention the 1990s because it also produced one of the greatest equity market environments. Given that the current yield for the US 10-year Treasury note was only 3.74% at that point, I suggested that the present environment wasn’t too constraining. In fact, I suggested that the environment was fairly loose.

Well, as we all know, the US Federal Reserve slashed the Fed Funds Rate by 0.5% on September 18th (4.75%-5.0%). Did this action lead bond investors to plow additional assets into the market driving rates further down? NO! In fact, since the Fed’s initial rate cut, Treasury yields have risen across the yield curve with the exceptions being ultra-short Treasury bills. Furthermore, the yield curve is positively sloping from 5s to 20s.

Again, managing cash flow matching portfolios means that we don’t have to be in the interest rate guessing game, but we are all students of the markets. It was out thinking in early September that markets had gotten too far ahead of the Fed given that the US economy remained on steady footing, the labor market continued to be resilient, and inflation, at least sticky inflation, remained stubbornly high relative to the Fed’s target of 2%. Nothing has changed since then except that the US labor market seems to be gaining momentum, as jobs growth is at a nearly 6-month high and the unemployment rate has retreated to 4.1%.

There will be more gyrations in the movement of US interest rates. But anyone believing that the Fed and market participants were going to drive rates back to ridiculously low levels should probably reconsider that stance at this time.

What A Ride!

By: Russ Kamp, Managing Director, Ryan ALM, Inc.

In 1971, Bread produced the song If. The song starts off with David Gates singing the lyrics, “if a picture paints a thousand words”. Looking at the graph below, I think that Bread and David could have used a number far greater than 1,000 to describe the impact that this picture might produce.

It never ceases to amaze me how momentum builds for an idea driving perceptions to depths or altitudes not supported by the underlying fundamentals. We see it so often in our markets whether discussing bonds, equities, or alternatives. In the case above, the “Street” became convinced that the US Federal Reserve was going to have to drive US interest rates down as our economy was about to collapse. A “please do something” cry could almost be heard from market participants who thrived on nearly four decades of Fed support. They were so accustomed to the Fed stepping in anytime that there was a wobble in the markets that it became part of the investment strategy.

It got so silly, that fixed income managers drove rates down substantially from the end of October to the end of 2023. In the process, they created an environment that was once again very “easy” and supportive of economic growth. But, that wasn’t the end of the story. I can recall a near unanimous expectation that there was going to be anywhere from 4-6 cuts in the Fed Funds Rate and perhaps more during 2024. We had analysts predicting 250 – 300 bps of rate cuts. Was the world ending?

I’ve produced more than 40 blog posts since March of 2022 that used the phrase “higher for longer” in describing an economic and inflationary environment that I felt was to robust for the Fed to reduce rates. Of course, there were many more posts in which I questioned the wisdom of the deflationary and lower rates crowd where I didn’t precisely utter those three words. Well, fortunately for pension America and the American worker, the US economy has held up in far greater fashion than predicted. The labor market remains fairly robust keeping Americans working and spending.

While inflation remains sticky and elevated, US rates have remained at decade highs providing defined benefit sponsors the opportunity to take substantial risk from the plan’s asset allocation framework through asset/liability strategies (read Cash Flow Matching) that secure the promises at substantially lower cost. As the chart above highlights, expectations for rate cuts have fallen from 4-6 or more to fewer than 2 at this point, as only a -31 bps decline is currently priced in. We’ve seen quite a repricing in 2024, and I suspect that we might need to see more, as “higher for longer” seems to be the approach being taken by the Fed.

While this is the case, plan sponsors would be wise to secure as many years of promised benefits as possible. Plan sponsors and their advisors let 2000 come and go without securing the benefits only to see two major market declines sabotage the opportunity and your plan’s funded status. Riding the asset allocation rollercoaster hasn’t worked. Is the car that you are riding in nearing the peak at this time?

What’s The Hurry?

By: Russ Kamp, Managing Director, Ryan ALM, Inc.

“Fed To Cut Rates in September, Say Nearly Two-thirds of Economists.”

This pronouncement was in large bold font on an email that I received this morning from the Wealth Advisor. Should I be skeptical? You bet!!

As you may recall, there was near unanimity among “economists” late last year that the US Federal Reserve would begin reducing rates RAPIDLY as the calendar flipped to 2024. In fact, consensus was fairly strong that there were going to be 4-6 cuts of between 1.0%-1.5%. There was even a leading bank that saw the need to reduce rates by 2.5% – oh, my. What happened? At this time I’m particularly interested in the 1/3 of economists that were predicting huge cuts at the end of 2023 that aren’t buying a September cut at this time. Those are the ones that I want to hear from.

What has changed from late last year when the labor market was strong, inflation was sticky, economic growth was stronger than expected, the stock market was raging ahead, and fiscal policy was in direct conflict with the Fed’s monetary objectives? Nothing has changed!

What is the urgency to cut rates? The Atlanta Fed’s GDPNow model is predicting a 4.2% annualized growth rate for Q2’24 (latest update as of May 8th). Does a growth rate of that magnitude warrant a rate cut? Heck no! Yes, there is the issue that most of today’s investors don’t remember the 1970s, if they were even born, but I do. Fed missteps lead directly to incredibly high inflation and US interest rates. Today’s rate environment is nothing compared to that era. Why risk a repeat? Stagflation became a reality. Is that something that you want to witness again?

Seniors and those living on a fixed income can finally earn some interest on their investments without having to dive into strategies that they don’t understand just to earn a little more interest. Pension plans can finally use fixed income to secure some or all of their promises to plan participants by matching bond cash flows of interest and principal with pension liabilities (benefits and expenses). Endowments and foundations can invest more cautiously knowing that they can earn a return from less risky assets that will help them achieve a return commensurate with their spending policy. This is all good stuff! Use this environment to take some of your assets off the asset allocation rollercoaster before our capital markets reach the apex of their journey. The next downward trajectory could be a doozy!

He Said What?

By: Russ Kamp, Managing Director, Ryan ALM, Inc.

I’d like to thank Bill Gross for his honest assessment that he just provided on the likely failure of “Total Return” bond products going forward. Here are his thoughts that were summarized in a Bloomberg Business email:

Bill Gross says his “total return” strategy—the one that revolutionized the bond market— “is dead”! Instead of just picking up steady interest payments like his peers did at the time, the co-founder of Pacific Investment Management created the firm’s Total Return Fund in 1987 to take active positions in duration, credit risk and volatility. The idea is that, more than just clipping coupons, bond investors can also benefit from capital appreciation as bond prices rise and yields fall. But in an outlook published Thursday, Gross noted what’s different now is that yields are much lower than when he first coined the concept, leaving investors with less room for price appreciation. 

We’ve been stressing this point for a long time now. Bonds should be used for the certainty of cash flows that they produce of interest and principal. Those cash flows are known and can be modeled with certainty (barring no defaults) to meet the liability cash flows of a pension plan (benefits) or foundation (grants). As Gross rightly points out, given the current level of US interest rates and inflation, just how much appreciation can be achieved, if an investor is on the correct side of a duration bet.

Capital market participants benefited tremendously during the nearly four decades decline in rates from 1981 to 2021. That move down in rates was certainly great for “total return” bond programs, but it also acted as rocket fuel for risk assets. What most market participants have either forgotten or don’t know is the fact that US interest rates trended higher for 28 years prior to the peak achieved in 1981. They are used to the Fed stepping into the fray every time there was a wiggle or wobble in the markets. Well, those days might be behind us.

Yes, US employment came in light this morning with 175k jobs being created in April when the forecast was for 240k, but that is one data point. We certainly witnessed an aggressive move down in rates during 2023’s fourth quarter only to see most of that move reversed to start 2024. Was your bond program able to get both directions correct or did your portfolio get whipsawed? Wouldn’t it be more comforting to know that you can install a cash flow matching portfolio that will SECURE the promises that have been made to the plan participants without having to guess the direction of rates? Even if one were to guess correctly, just how far will rates fall given that inflation remains sticky? Are you likely to see negative real yields?

The US economy remains robust. Fiscal policy remains easy with excessive Government spending and in direct competition with monetary policy. The labor market continues to be strong, as is wage growth. The stock market’s performance continues to support the economy. Given these realities, why should US rates plummet, which is what it would take to create an investing horizon that would be supportive of “total return” fixed income products.

CFM: Buy Time and Reduce Risk

By: Russ Kamp, Managing Director, Ryan ALM, Inc.

A traditional DB plan’s asset allocation comes with a lot of annual volatility (see the graph below). That volatility gets reduced as one extends the investing horizon, but it is still quite uncertain until you extend sufficiently, such as 10 or more years. However, as plan sponsors and investment managers, we have been living in a quarter-to-quarter measurement cycle for decades. In that environment, a 1 standard deviation (1 SD) measurement for a 1-year time frame (Ryan ALM asset allocation model since 1999) is +/- 10.5%. In the example below, 68% of the observations (1 SD) will fall between 16.5% and -4.5%. A 2 SD measurement would have the range for 95% of the observations between 27% and -15%. That gap, or should I say canyon, is a 1-year observation. Extend the measurement period to 5-years and the range of results is still wide but less so at +/- 9.8% for 2 SDs. It isn’t until you get beyond 10 years that the volatility associated with a fairly traditional asset allocation gets to a reasonable level.

Is there a way to bring more certainty to the asset allocation process that would allow for longer observation periods and less volatility? Absolutely! A plan sponsor and their advisors can adopt a bifurcated asset allocation in which a liquidity bucket is created that will fund and match the plan’s liability cash flows of benefits and expenses chronologically from the next month as far out as the allocation will cover (10+ years) allowing for the remainder of the alpha assets (all non-bond assets) to now grow unencumbered. The task for those assets is to meet future liabilities.

As the graph below highlights, a carefully constructed cash flow matching (CFM) portfolio can help plan sponsors wade through the volatility associated with shorter timeframes. The CFM portfolio will consist of investment grade bonds whose cash flows of interest and principal will be matched to the liability cash flows. This process now ensures (absent defaults) that the necessary liquidity is available when needed as those future promises have been SECURED. The remaining assets can now be managed as aggressively as the plan’s funded status dictates.

With this process, short-term market dislocations will no longer impact the plan’s ability to meet its obligations. There will be no forced selling to meet benefit payments. The alpha assets can now grow without fear of being sold at an unreasonable level. The CFM program takes care of your needs while establishing a buffer (longer investing horizon) from market corrections that happen on a fairly regular basis. This structure should also lead to less volatility related to contributions and the plan’s funded status.

Given the elevated US interest rate environment, now is the time to engage in this process. CFM will provide a level of certainty that doesn’t exist in a traditional asset allocation. This is a “sleep well at night” strategy that should become the core holding for DB pensions. As I mentioned in an earlier blog post today, bonds should only be used for the cash flows they produce. They should not be used as total return-seeking instruments. Leave that task to the alpha assets that will benefit from a longer investing period.

Healthier Than Ever? Nah!

By: Russ Kamp, Managing Director, Ryan ALM, Inc.

P&I produced an article yesterday titled, “Corporate Pension Funds Are Fully Funded, Healthier Than Ever. Now What?” According to Milliman, corporate pension plans are averaging roughly a funded ratio of 106%. This represents a healthy funded status, but it is by no means the healthiest ever. One may recall that corporate plans were funded in excess of 120% as recently as 2000. In what might be more shocking news, public pension plans were too when using a market discount rate (ASC 715 discount rate). Today, those public pension plans have a funded status of roughly 80% according to Milliman’s latest public fund report.

The question, “Now what”? is absolutely the right question to be asking. Many corporate plans have already begun de-risking, as the average exposure to fixed income is >45% according to P&I’s asset allocation survey through November 2023. Unfortunately, public pension systems still sit with only about 18% exposure to US fixed income, preferring a “let it ride” mentality as equities and alternatives account for more than 75% of the average plan’s asset allocation. Is this the right move? No. The move into alternatives has dried up liquidity, increased fees, and reduced transparency. Furthermore, just because a public plan believes that its sponsor is perpetual, does that make the system sustainable? You may want to be reminded about Jacksonville Police and Fire. There are other examples, too.

Whether the pension plan is corporate, multiemployer, or public, the asset allocation should reflect the funded status. There is no reason that a 60% funded plan should have the same asset allocation as one that is 90% or better funded. All plans should have both liquidity and growth buckets. The liquidity bucket will be a bond allocation (investment grade corporates in our case) that matches asset cash flows to liability cash flows of benefits and expenses. That bucket will provide all of the necessary liquidity as far into the future as the pension system can afford. The remaining assets will be focused on outperforming future liability growth. These assets will be non-bonds that now have the benefit of an extended investing horizon to grow unencumbered. Forcing liquidity in environments in which natural liquidity has been compromised only serves to exacerbate the downward spiral.

Pension America has the opportunity to stabilize the funded status and contribution expenses. They also have the chance to SECURE a portion of the promises. How comforting! We saw this movie a little more than 20 years ago. Are we going to treat this opportunity as a Ground Hog Day event and do nothing or are we going to be thoughtful in taking appropriate measures to reduce risk before the markets bludgeon the funded status? The time to act is now. Not after the fact.

How “Real” Will the Fed Get?

By: Ronald J. Ryan, CEO, Ryan ALM, Inc.

Chairman Powell and the Fed have consistently said they want real rates. The Fed primarily focuses on the Personal Consumption Expenditures (PCE) as their gauge of inflation. Currently the PCE is at 2.7%. What the Fed has not said is the target level of real rates. Historically, real rates as measured by the St. Louis Fed have averaged about 3.0% although the trend line has decreased steadily since the 1980s (see graph below). With the PCE at 2.7% today a 2% to 3% real rate would suggest a 4.70% to 5.70% 10-year Treasury nominal rate. With the 10-year Treasury at 4.66% today, it would seem that there is no reason for any cut in rates by the Fed. In fact, there may be more reason to increase rates.

The question remains… where will inflation (as measured by the PCE) level off? Who knows since there are too many factors to consider. The major causes of inflation today seem to be:

  1. Excessive Government Spending

Biden 2025 budget of $7.3 trillion is 12.3% higher than the 2024 budget of $6.5 trillion. Jamie Dimon, CEO of JP Morgan Chase, warns that excessive deficit spending is inflationary and that interest rates could spike up to 8%. The Biden Administration Student Loan forgiveness package could increase the deficit by $430 billion if successful.

  • Oil Prices

       West Texas Intermediate (WTI) Crude oil prices are up over 19% in 2024.

  • Red Sea Attacks

About 12% of global trade goes through here to the Suez Canal. Ships now have to be rerouted around southern tip of Africa creating a delay of about two weeks at a cost of $3,786 per vessel or about $1 million per week. According to Drewry World Container Index costs are up over 90% YoY.

  • Francis Scott Key Bridge Collapse

One of the largest ports in America handling $80 billion in cargo annually. Estimated closure costs = $15 million per day with closure expected for two to three years.

As always, the motto “let the buyer beware” (Caveat Emptor) seems to apply here.

ARPA Update as of April 26, 2024

By: Russ Kamp, Managing Director, Ryan ALM, Inc.

Can you believe that a 1/3 of 2024 will soon be behind us? It is finally feeling like Spring in NJ today.

There is not much to discuss regarding the PBGC’s implementation of the ARPA pension legislation. According to the latest update, there were no new applications filed, approved, denied, or withdrawn. However, there was one fund that received the SFA. United Food and Commercial Workers Union Local 152 Retail Meat Pension Plan, a Mount Laurel, NJ, plan received SFA and interest in the amount of $279.3 million for the more than 10k plan participants.

There currently are 114 names on the waitlist. Of those, 27 have been invited to submit applications. As the data above reflects, 8 of those applications have been approved, 12 are currently under review, while another 7 have been withdrawn presumably to have the submission corrected and resubmitted. In addition to that activity, 112 of the 114 funds have locked-in a valuation date for SFA measurement (discount rate). Ninety-two percent of those chose 12/31/22, while 2 have no lock-up and the other 9 have chosen dates between December 31, 2022 and November 30, 2023. As a reminder, the SFA is based on a series of discount rates. The lower the rate, the greater the potential SFA. Using the 10-year Treasury yield as a proxy for the discount rate, those plans locking in an evaluation date as of year-end 2022 have done alright, as the yield at the end of 2022 was 3.88%, while it currently stands at 4.63% (4/29 at 3:39 pm).

We’ll have to see if the others have faired as well. In the meantime, the higher US interest rates have certainly helped from an investment standpoint, as the current environment is providing 5%+ YTM investment grade bond portfolios. The higher rates reduce the cost of those future promises while extending the coverage period to secure benefits through a cash flow matching investment strategy.

Milliman Reports Improved Funding For Public Fund Pension Plans as of March 31, 2024

By: Russ Kamp, Managing Director, Ryan ALM, Inc.

Milliman recently released results for its Public Pension Funding Index (PPFI), which covers the nation’s 100 largest public defined benefit plans.

Positive equity market performance in March increased the Milliman 100 PPFI funded ratio from 78.6% at the end of February to 79.7% as of March 31, representing the highest level since March 31, 2022, prior to the Fed’s aggressive rate increases. The previous high-water mark stood at 82.7%. The improved funding for Milliman’s PPFI plans was driven by an estimated 1.7% aggregate return for March 2024. Total fund performance for these 100 public plans ranged from an estimated 0.9% to 2.6% for the month. As a result of the relatively strong performance, PPFI plans gained approximately $85 billion in MV in March. The asset growth was offset by negative cash flow amounting to about $9 billion. It is estimated that the current asset shortfall relative to accrued liabilities is about $1.271 trillion as of March 31. 

In addition, it was reported that an additional 4 of the PPFI members had achieved a 90% or better funded status, while regrettably, 15 of the constituents remain at <60%. Given that changing US interest rates do not impact the calculation for pension liabilities under GASB accounting, the improvement in March’s collective funded status may be underreported, as US rates continued the upward trajectory begun as the calendar turned to 2024.