Buy on the Rumor…

By: Russ Kamp, CEO, Ryan ALM, Inc.

After 44-years in the investment industry I’ve pretty much heard most of the sayings, including the phrase “buy on the rumor and sell on the news”. I suspect that most of you have probably heard those words uttered, too. However, it isn’t always easy to point out an example. Here is graph that might just do the trick.

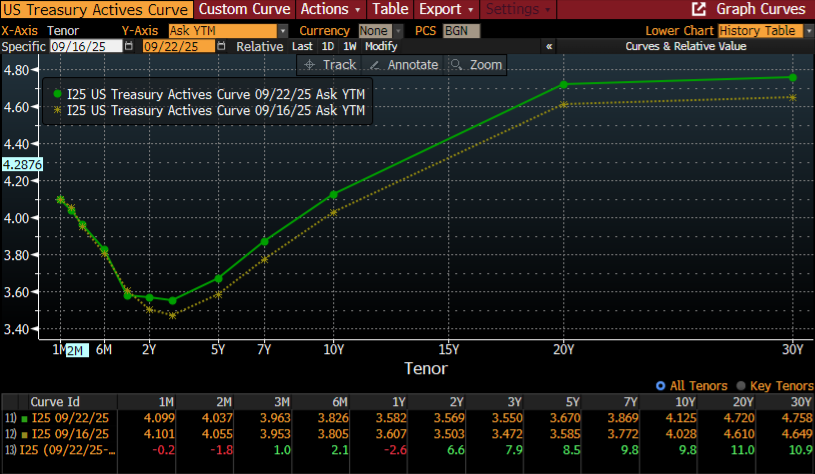
There had been significant anticipation that the U.S Federal Reserve would cut the Fed Funds Rate and last week that expectation was finally realized with a 0.25% trimming. However, it appears that for some of the investment community that reduction wasn’t what they were expecting. As the graph above highlights, the green line representing Treasury yields as of this morning, have risen nicely in just the last 6 days for most maturities 3 months and out, with the exception of the 1-year note. In fact, the 10- and 30-year bonds have seen yields rise roughly 10 bps. Now, we’ve seen more significant moves on a daily basis in the last couple of years, but the timing is what has me thinking.

There are still many who believe that this cut is the first of several between now and the end of 2025. However, there is also some trepidation on the part of some in the bond world given the recent rise in inflation after a prolonged period of decline. As a reminder, the Fed does have a dual mandate focused on both employment and inflation, and although the U.S. labor force has shown signs of weakening, is that weakness creating concerns that dwarf the potential negative impact from rising prices? As stated above, there may also have been some that anticipated the Fed surprising the markets by slicing rates by 0.50% instead of the 0.25% announced.

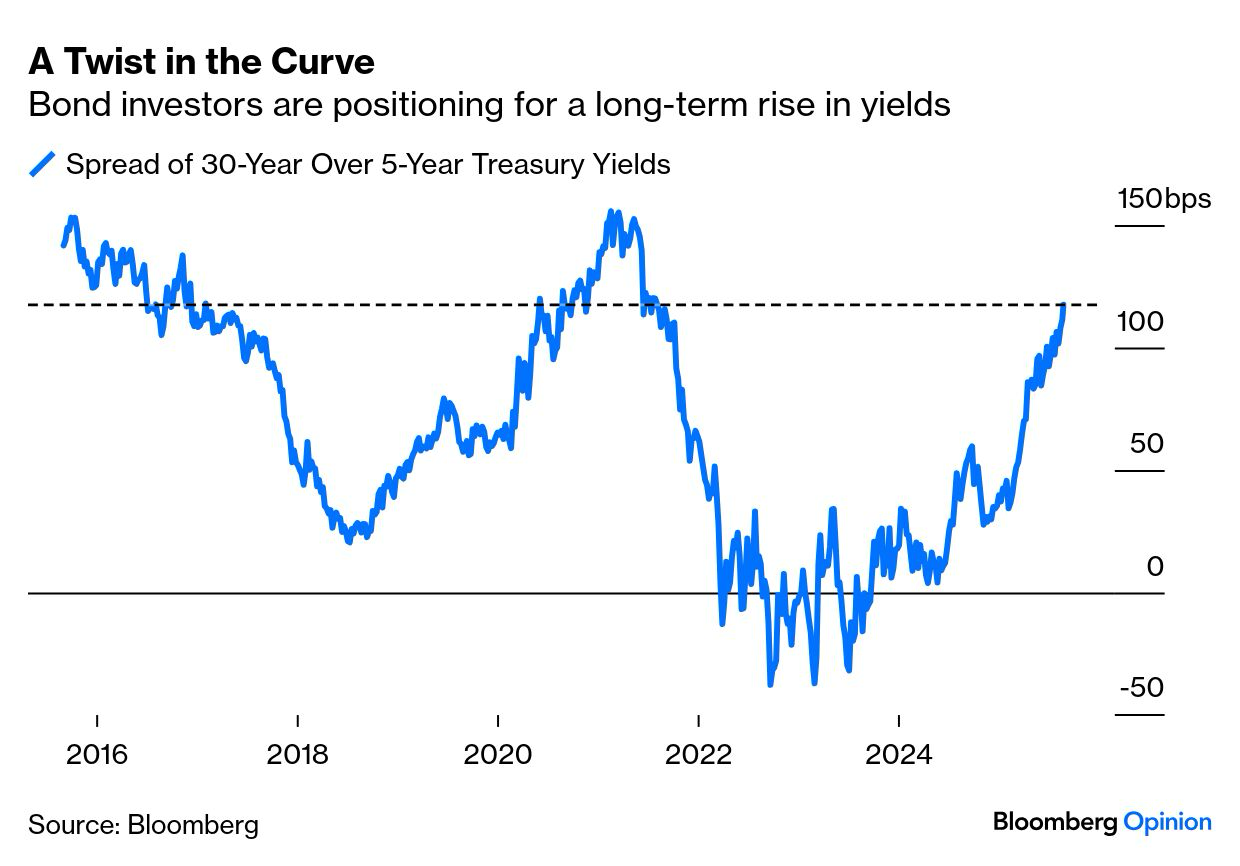
In any case, the interest rate path is not straight and with curves one’s vision can become obstructed. What we might just see is a steepening of the Treasury yield curve with longer dated maturities maintaining current levels, if not rising, while the Fed does their thing with short-term rates. That steepening in the curve is beneficial for cash flow matching assignments that can span 10- or more years, as the longer the maturity and the higher the yield, the greater the cost reduction to defease future liabilities. Please don’t let this attractive yield environment come and go before securing some of the pension promises.

I’m Concerned! Are You?

By: Russ Kamp, CEO, Ryan ALM, Inc.

I’ve been concerned about the U.S. retirement industry for many years, with a particular focus on traditional pensions. The demise of DB pensions is a major social and economic issue for a significant majority of American workers, who fear that their golden years will be greatly tarnished without the support of a traditional DB pension plan coupled with their inability to fund a supplemental retirement vehicle, such as a defined contribution plan.

I recently had hope that the rising U.S. interest rate environment would bring about a sea change in the use of DB pensions, but I haven’t seen the tidal wave yet. That said, the higher rate environment did (could still) provide plan sponsors with the ability to take some risk off the table, but outside of private pensions, I’ve witnessed little movement away from a traditional asset allocation framework. You see, the higher rate environment reduces the present value cost of those future benefit payments improving both the funded ratio and funded status of DB pensions, while possibly reducing ongoing contributions. Securing those benefits, even for just 10-years dramatically reduces risk.

But, again, I’ve witnessed too few plans engaging in alternative asset allocation strategies. That’s not the same as engaging in alternative strategies, which unfortunately continues to be all the rage despite the significant flows into these products, which will likely diminish future returns, and the lack of distributions from them, too. An alternative asset allocation strategy that Ryan ALM supports and recommends is the bifurcation of assets into two buckets – liquidity and growth – as opposed to having all of the plan’s assets focused on the return on asset (ROA) assumption.

By dividing the assets into two buckets, one can achieve multiple goals simultaneously. The liquidity bucket, constituting investment grade bonds, will be used to defease the liability cash flows of benefits and expenses, while the growth or alpha assets can grow unencumbered with the goal of being used to defease future liabilities (current active lives). One of the most important investment tenets is time. As mentioned above, defeasing pension liabilities for even 10-years dramatically enhances the probability of the alpha assets achieving the desired outcome.

So why am I concerned? The lack of risk mitigation is of great concern. I’m tired of watching pensions ride the rollercoaster of returns up and down until something breaks, which usually means contributions go up and benefits go down! Given the great uncertainty related to both the economy and the labor force, why would anyone embrace the status quo resulting in many sleepless nights? Do something, and not just for the sake of doing something. Really do something! Embrace the asset allocation framework that we espouse. Migrate your current core bond allocation to a defeased bond allocation known as cash flow matching (CFM) to bring an element of certainty to the management of your plan.

Listen, if rates fall as a result of a deteriorating labor force and economy, the present value of pension liabilities will rise. Given that scenario, it is highly likely that asset prices will fall, too. That is a lethal combination, and not unique given how many times I’ve seen that play out during my 44-year career. Reach out to us if you aren’t sure how to start the process. We’d be pleased to take you through a series of scenarios so that you can determine what is possible. Perhaps you’ll sleep like a baby after we talk.

Not So Fast

By: Russ Kamp, CEO, Ryan ALM, Inc.

In addition to publishing my thoughts through this blog, I frequently put sound bites out through LinkedIn.com. The following is an example of such a comment: Given Powell’s statement about “balancing dual mandates”, it seems premature to assume that the Fed’s next move on rates is downward. Tariffs have only recently kicked in and their presence could create a very challenging situation for the Fed should inflation continue on its path upward. Market reaction seems overblown. September’s CPI/PPI numbers could be very interesting.

As a follow-up to that comment, here is a graph from Bloomberg highlighting the recent widening in the spread between 5-year and 30-year Treasuries, which is at its widest point in the last 4 years.  This steeping of the yield curve would suggest that inflation is being more heavily anticipated on the long end.

As I mentioned above, the reaction to Powell’s comments from Wyoming last Friday seemed overblown given the rethinking about “dual mandates”. Inflation has recently reversed the downward trajectory and with the impact of tariffs yet to be truly felt, it is doubtful that we’ll see inflation fall to levels that would provide comfort to the U.S. Federal Reserve policy makers. Yes, there may be a small (25 bps) cut in September, but should inflation continue to be a concern the spread in Treasury yields referenced above could continue to widen. President Trump’s goal of jumpstarting the housing market through lower mortgage rates would not likely occur.

From a pension perspective, higher rates reduce the present value of those future promised benefits. They also provide implementers of cash flow matching (CFM) strategies, such as Ryan ALM Advisers, LLC, the opportunity to defease those pension liabilities at a lower cost (greater cost savings). Bond math is very straight forward. The higher the yield and the longer the maturity, the greater the cost savings. Although higher rates might not be good for U.S. equities, especially given their current valuations, the ability to reduce risk at this time through a CFM strategy should be comforting.

Bifurcate your asset allocation into two buckets – liquidity and growth. The liquidity bucket will house the CFM strategy, providing all the necessary liquidity to meet ongoing monthly obligations as far into the future as the allocation will cover. The remaining assets (all non-core bonds) in the growth or alpha portfolio will now have more time to just grow unencumbered, as they are no longer a source of liquidity. Time is a critical investment tenet, and with more time, the probability of meeting the expected return is enhanced.

There is tremendous uncertainty in our markets and economy currently. One can bring an element of certainty to the management of pensions, live with great uncertainty.

Are Investors About to Get Their Comeuppance?

By: Russ Kamp, CEO, Ryan ALM, Inc.

As we’ve discussed in this blog on many occasions, the U.S. interest rate decline from 1982 to 2022 fueled risk assets well beyond their fundamentals. During the rate decline, investors became accustomed to the US Federal Reserve stepping in when markets and the economy looked dicey. There seems to be a massive expectation that the “Fed” will once again support those same risk assets by initiating another rally through a rate decline perhaps as soon as September. Is that action justified? I think not!

Recent inflation data, including today’s PPI that came in at 0.9% vs. 0.2% expected, should give pause to the crowd screaming for lower rates. Yes, employment #s published last week were very weak, and they got weaker when Erika McEntarfer, the commissioner of the Bureau of Labor Statistics, was fired after releasing a jobs report that angered President Donald Trump. In addition, we have Secretary of the Treasury, Scott Bessent, demanding rates be cut by as much as 150-175 bps, claiming that all forecasting “models” suggest the same direction for rates. Is that true? Again, I think not.

You may recall that I published a blog post on July 10, 2025 titled “Taylor-Made”, in which I wrote that the Taylor Rule is an economic formula that provides guidance on how central banks, such as the Federal Reserve, should set interest rates in response to changes in inflation and economic output. The rule is designed to help stabilize an economy by systematically adjusting the central bank’s key policy rate based on current economic conditions. It is designed to take the “guess work” out of establishing interest rate policy.

In John Authers (Bloomberg) blog post today, he shared the following chart:

Calling for a roughly 2.6% Fed Funds rate in an environment of 3% or more core and sticky inflation is not prudent, and it is not supported by history. Furthermore, the potential impact from tariffs will only begin to be felt as most went into effect as of August 1, 2025.

Getting back to the Taylor Rule, Authers also provided an updated graph suggesting that the Fed Funds rate should be higher today. In fact, it should be at a level about 100 bps above the current 4.3% and more than 270 bps above the level that Bessent desires.

Investors would be wise to exit the lower interest rate train before it fuels a significant increase in U.S. rates as inflation once again rises. The impact of higher rates will negatively impact all risk assets. Given that a Cash Flow Matching (CFM) strategy eliminates interest rate risk through the defeasement of benefits and expenses that are future values and thus not interest rate sensitive, one could bring an element of certainty to this very uncertain economic environment before investors get their comeuppance! Don’t wait for the greater inflation to appear, as it might just be too late at that point to get off the lower interest rate train before it plummets into a ravine.

Really Only One Significant Influence

By: Russ Kamp, CEO, Ryan ALM, Inc.

Managing fixed income (bonds) can be challenging as there are a plethora of risks that must be evaluated including, but not limited to, credit, liquidity, maturity/duration, yield, prepayment and reinvestment risk, etc. within the investment-grade universe. But the greatest risk – uncertainty – remains interest rate risk. Who really knows the future direction of rates? As the graph below highlights, U.S. interest rates have moved in long-term secular trends with numerous reversals along the way. Does that mean that we are headed for a protracted period of rising rates similar to what was witnessed from 1953 to 1981 or is this a head fake along the path to historically low rates?

When rates are falling, it is very good for bonds as they not only capture the coupon, but they get some capital appreciation, too. However, when rates rise, it is a very different game. Yes, rising interest rates are very good for pension funds from a liability perspective, as the present value (PV) of those future benefit payments (I.e. liabilities) is reduced, but the asset side may be hurt and not only for bonds but other asset classes as well.

No alternative text description for this image

This is the primary reason why bonds should be used for their cash flows of interest and principal and not as a performance generator. The cash flows should be used to meet monthly benefits and expenses chronologically through a cash flow matching strategy (CFM). Unfortunately, Bonds are frequently used for performance and perhaps diversification benefits while compared to a generic index, such as the BB Aggregate index, which doesn’t reflect the unique characteristics of the pension plan’s liabilities.

U.S. interest rates are presently elevated but aren’t high by historic standards. However, the current level of rates does provide the plan sponsor with a wonderful opportunity to take risk from their traditional asset allocation by defeasing a portion of the plan’s liabilities from next month out as far as the allocation will cover. While the bond portfolio is funding monthly obligations, the remaining assets can just grow unencumbered.

Given the uncertainty regarding the current inflationary environment, betting that U.S. rates will fall making a potential “investment” in bonds more lucrative is nothing short of a crapshoot. Investing in a CFM strategy helps to mitigate interest rate risk as future values are not interest rate sensitive.

Taylor-Made?

By: Russ Kamp, CEO, Ryan ALM, Inc.

The Federal Reserve meeting notes have been published, and there seems to be little appetite among the Fed Governors to reduce U.S. interest rates at the next meeting. They continue to believe that the recently inflated tariffs and current trade policy actions could lead to greater inflationary pressures. These notes do not support the current administration’s push to see the Fed Funds Rate dropped significantly – perhaps as much as 3%.

In a very informative Bloomberg post from this morning, John Authers reminded everyone that President Trump selected Jerome Powell over John Taylor, Stanford University, in 2017 to become Chairman of the Federal Reserve. I must admit that I didn’t remember that being the case, while also not recalling that it is John Taylor who is credited with developing the Taylor Rule in 1993. When I think of famous Taylors, John isn’t at the top of my list. I might have believed that it had something to do with Lawrence Taylor’s dominance on the football field where he “ruled” for 13 Hall of Fame seasons and is considered by many the greatest defensive player in NFL history (yes, I am a Giants’ fan).

So, what is the Taylor Rule? The Taylor Rule is an economic formula that provides guidance on how central banks, such as the Federal Reserve, should set interest rates in response to changes in inflation and economic output. The rule is designed to help stabilize an economy by systematically adjusting the central bank’s key policy rate based on current economic conditions. It is designed to take the “guess work” out of establishing interest rate policy.

The Taylor rule suggests that the central bank should raise interest rates when inflation is above its target (currently 2%) or when GDP is growing faster than its estimated potential (overheating). Conversely, it suggests lowering interest rates when inflation is below target or when GDP is below potential (economy is underperforming). Ironically, President Trump’s dissatisfaction with Jerome Powell’s reluctance to reduce rates given significant economic uncertainty, may have been magnified by John Taylor’s model, which would have had rates higher at this time as reflected in the graph below.

As a reminder, Ryan ALM, Inc. does not forecast interest rates as part of our cash flow matching (CFM) strategy. In fact, the use of CFM to defease pension liabilities (benefits and expenses (B&E)) eliminates interest rate risk once the portfolio is built since future values (B&E) aren’t interest rate sensitive. That said, the currently higher rate environment is great for pension plan sponsors who desire to bring an element of certainty to the management of pensions which tend to live in a very uncertain existence. By funding a CFM portfolio, plan sponsors can ensure that proper liquidity is available each month of the assignment, while providing the residual assets time to grow. There are many other benefits, as well.

Since we don’t know where rates are likely to go, we highly recommend engaging a CFM program sooner rather than later before we find that lower interest rates have caused the potential benefits (cost savings) provided by CFM to fall.

U.S. $ Decline and the Impact on Inflation

By: Russ Kamp, CEO, Ryan ALM, Inc.

As I was contemplating my next blog post, I took a look at how many of my previous >1,625+ posts mentioned currencies, and specifically the U.S. $. NEVER had I written about the U.S. $ other than referencing the fact that we enjoy the benefit of a fiat currency. I did mention Bitcoin and other cryptos, but stated that I didn’t believe that they were currencies and still don’t. Why mention them now? Well, the U.S. $ has been falling relative to nearly all currencies for most of 2025. According to the WSJ’s Dollar Index (BUXX), the $ has fallen by 8.5% for the first half of 2025.

Relative to the Euro, the $ has fallen nearly 14% and the trend isn’t much better against the Pound (-9.6%) and the Yen (-8.7%). So, what are the implications for the U.S. given the weakening currency? First, the cost of imports rises. When the $ loses value, it costs more to buy goods and services from abroad. The likely outcome is that the increased costs get passed onto the consumer, who is already dealing with the implications from uncertain tariff policies.

Yes, exports become cheaper, which would hopefully increase demand for our goods, but the heightened demand could also lead to greater demand for U.S. workers in order to meet that demand leading to rising wages (great), but that is also potentially inflationary.

What have we seen so far? Well, first quarter’s GDP (-0.5%) reflected an increase in imports spurred on by fear of price increases due to the potential for tariffs. Q2’25 is currently forecasted to be 2.5% according to the Atlanta Fed’s GDPNow model, as U.S. imports have fallen. According to the BLS, import prices have risen in 4 of 5 months in 2025, with March’s sharp decline the only outlier.

The potential inflationary impact from rising costs could lead to higher U.S. interest rates, which have been swinging back and forth depending on the day of the week and the news cycle. Furthermore, there is fear that the proposed “Big Beautiful Bill” could also drive rates higher due to the potential increase in the federal deficit by nearly $5 trillion due to the stimulative nature of deficits. Obviously, higher U.S rates are great for individual savers, but they don’t help bonds as principal values fall.

We recommend that plan sponsors and their advisors use bonds for the cash flows (interest and principal) and not as a performance driver. Use the fixed income exposure as a liquidity bucket designed to meet monthly benefits and expenses through the use of Cash Flow Matching (CFM), which will orchestrate a careful match of asset cash flows funding the projected liabilities cash flows. The remaining assets (alpha bucket) now benefit from time, as the investment horizon is extended.

Price increases on imports due to a weakening $ can impact U.S. inflation, but there are other factors, too. I’ve already mentioned tariffs and wage growth, but there other factors, including productivity and global supply chains. Some of these drivers may take more time to hash out. There are many uncertainties that could potentially impact markets, why not bring an element of certainty to your pension fund through CFM.

FOMC and Powell Deliver Worrying Message

By: Russ Kamp, CEO, Ryan ALM, Inc.

I produced a post recently titled, “Parallels to the 1970s?” in which I discussed the challenging economic environment that existed during the 1970s as a result of two oil shocks and some sketchy decision making on the part of the US Federal Reserve. The decade brought us a new economic condition called stagflation, which was a term coined in 1965 by British politician Lain Macleod, but not widely used or recognized until the first oil embargo in 1973. Stagflation is created when slow economic growth and inflation are evident at the same time.

According to the graph above, the FOMC is beginning to worry about stagflation reappearing in our current economy, as they reduced the expectations for GDP growth (the Atlanta Fed’s GDPNow model has Q1’25 growth at -1.8%), while simultaneously forecasting the likelihood of rising inflation. Not good. If you think that the FOMC is being overly cautious, look at the recent inflation forecasts from several other entities. Seems like a pattern to me.

Yet, market participants absorbed the Powell update as being quite positive for both stocks and bonds, as markets rallied soon after the announcement that the FOMC had held rates steady. Why? There is great uncertainty as to the magnitude and impact of tariffs on US trade and economic growth. If inflation does move as forecasted, why would you want to own an active bond strategy? If growth is moderating, and in some cases forecasted to collapse, why would you want to own stocks? Aren’t earnings going to be hurt in an environment of weaker economic activity? Given current valuations, despite the recent pullback, caution should be the name of the game. But, it seems like risk on.

Given the uncertainty, I would want to engage in a strategy, like cash flow matching (CFM), that brought an element of certainty to this very confusing environment. CFM will fully fund the liability cash flows (benefits and expenses) with certainty providing timely and proper liquidity to meet my near-term obligations, so that I was never in a position where I had to force liquidity where natural liquidity wasn’t available. Protecting the funded ratio of my pension plan would be a paramount objective, especially given how far most plans have come to achieve an improved funding status.

I’ve written on many occasions that the nearly four decades decline in rates was the rocket fuel that drove risk assets to incredible heights. It covered up a lot of sins in how pensions operated. If a decline in rates is the only thing that is going to prop up these markets, I doubt that you’ll be pleased in the near-term. Bifurcate your assets into two buckets – liquidity and growth – and buy time for your pension plan to wade through what might be a very challenging market environment. The FOMC was right to hold rates steady. Who knows what their next move will be, but in the meantime don’t bet the ranch that inflation will be corralled anytime soon.

Real GDP Exceeding Real Potential GDP

By: Russ Kamp, CEO, Ryan ALM, Inc.

I was introduced to the St. Louis Fed’s amazing data base – FRED – many years ago by a former Invesco colleague. What is FRED? According to the St. Louis Fed’s website, “FRED is short for Federal Reserve Economic Data, and FRED is an online database consisting of hundreds of thousands of economic data time series (presently >825k) from scores of national, international, public, and private sources. FRED, created and maintained by the Research Department at the Federal Reserve Bank of St. Louis, goes far beyond simply providing data: It combines data with a powerful mix of tools that help the user understand, interact with, display, and disseminate the data.”

FRED is an amazing tool, but the purpose of this blog today is not to laud FRED, but to highlight two data series that I have followed for several years – Real GDP and Real Potential GDP. Real GDP is self-explanatory, but what is Real Potential GDP? “Real potential GDP is the CBO’s estimate of the output the economy would produce with a high rate of use of its capital and labor resources. The data is adjusted to remove the effects of inflation.” The data series starts in Q1’49 and currently runs to Q4’2034, which forecasts Real GDP to be $27.8 trillion at that time. Real GDP is currently (Q4’24) at $23.5 trillion.

Currently, Real GDP is exceeding what the CBO believes is the Real Potential GDP for our economy by a record amount of $616 billion in $ terms or about 2.5%. If you believe that the CBO’s estimate of potential GDP is close to reality, then it shouldn’t be surprising that inflation remains an issue, despite the marginal improvement disclosed earlier this week (core CPI at 3.1%). As my former colleague and mentor, Charles DuBois has said, “if government spending (or private spending, for that matter) exceeds the economy’s real resources available to absorb that spending, then inflation will likely result.” That’s where we are today, folks.

The growing and fairly consistent fiscal deficit continues to provide stimulus to the private sector (all spending = all income) creating demand for goods and services that exceeds the natural capacity of our economy as measured by the CBO despite the Fed’s aggressive action to temper some of that demand through elevated interest rates, which began in March 2022. While this relationship exists, it makes sense for the Fed to pause its easing of rates, which they seem to have at this time, but we’ll get more insight when they meet next week.

Also reflected in the graph above, previous peaks in Real GDP exceeding the CBO’s Real Potential GDP (’73, ’78, ’89, ’99, ’07) have been followed by economic and market disruptions, some quite significant. What does that portend for today’s market given the current levels?

Parallels to the 1970s?

By: Russ Kamp, CEO, Ryan ALM, Inc.

My recollection of the 1970s has more to do with playing high school sports, graduating from PPHS in 1977, and then going off to Fordham where I would meet my wife in an economics class in 1979. I wasn’t really focused on the economy throughout much of the decade. You see, college was reasonably affordable, and gas and tolls (GWB) were not priced outrageously, so getting back and forth to the Bronx wasn’t crushing for me and my parents.

However, I do recall the two oil embargoes that rocked the economy during the decade. I vividly recall the 1973 oil embargo that was triggered by the Yom Kippur War. I was a newspaper delivery boy for the Hudson Dispatch and was frequently amazed by the long gas lines that would stretch for blocks on both odd and even days, as I drove by on my bike. The Organization of Arab Petroleum Exporting Countries instituted the oil embargo against any country supporting Israel, including the U.S. This led to a dramatic increase in oil prices from about $3/barrel to roughly $12/barrel. This action led to widespread economic disruption, and as you can imagine, significant inflationary pressures.

The 1979 oil crisis was precipitated by the Iranian Revolution which saw the overthrow of the Shah of Iran in February 1979. The Revolution created a significant disruption in oil production in Iran, causing global oil supply issues. Similarly, to the 1973 crisis, oil prices surged from about $14/barrel to nearly $40/barrel. Once again, gasoline shortages materialized and inflation rose rather dramatically. This oil impact would lead to a period of economic stagnation that would eventually be defined as “stagflation”.

Now, I am NOT saying that we are about to face significant oil embargoes. But I am reminding everyone that history does have a tendency to repeat itself even if the players aren’t exactly the same. The graph below is pretty eye-opening, at least to me.

For those of you who can recall the 1970s, you’ll remember that the US Federal Reserve tried to mitigate inflation through aggressive increases in the Fed Funds Rate, which would eventually hit 20% in March 1980. As a result of their action, U.S. Treasury yields rose dramatically, too. For instance, the yield on the US 10-year Treasury note would peak at 15.84% in September 1981. As an FYI, I would enter our industry in October 1981.

Despite the aggressive action by the Fed’s FOMC beginning in March 2022, inflation has not been brought under control. Were they premature in reducing the FFR 3 times and by 1% to end 2024? A case could certainly be made that they were. So, where do we go from here? There certainly appears to be some warning signs that inflation could raise its ugly head once more. We are in the midst of a rebound in food inflation, and not just eggs. I just read this morning that those heating with natural gas will see about a 10% increase in their bills relative to last year – ouch. There are other worrying signs as well without even getting into the potential impact from policy changes brought about by the new administration.

It is quite doubtful that we will witness peaks in inflation and interest rates described above, but who really knows? Given the great uncertainty, and the potentially significant ramifications of a renewed inflationary cycle (2022 was not that long ago), plan sponsors should be working diligently to secure the current funding levels for their plans. Why continue to subject all of the assets to the whims of the markets for which they have no control over? Inflationary concerns rocked both the equity and bond markets in 2022. In fact, the BB Aggregate Index suffered its worst loss (-13%) by more than 4X the previous worst annual return (-2.9% in 1994). Rising rates crush traditional core fixed income strategies, but they are a beautiful benefit when matching asset cash flows (principal and interest) to liability cash flows (benefits and expenses) through CFM.

As a plan sponsor, I’d want to find as much certainty as possible, given the abundant uncertainty of markets each and every day. As Milliman has reported, both private and public pension funded ratios are at levels not seen in years. Don’t blow it now!