By: Russ Kamp, CEO, Ryan ALM, Inc.
Welcome to FOMC week. I wouldn’t ordinarily mention the Federal Reserve in the ARPA update, but we could see an interest rate cut, and perhaps one that is larger than currently anticipated. The implications from falling interest rates are potential large, as it raises the costs to defease pension liabilities (benefits and expenses) that would be secured through the SFA grant by reducing the coverage period. This impact could be potentially diminished if the yield curve were to steepen given recent inflationary news.
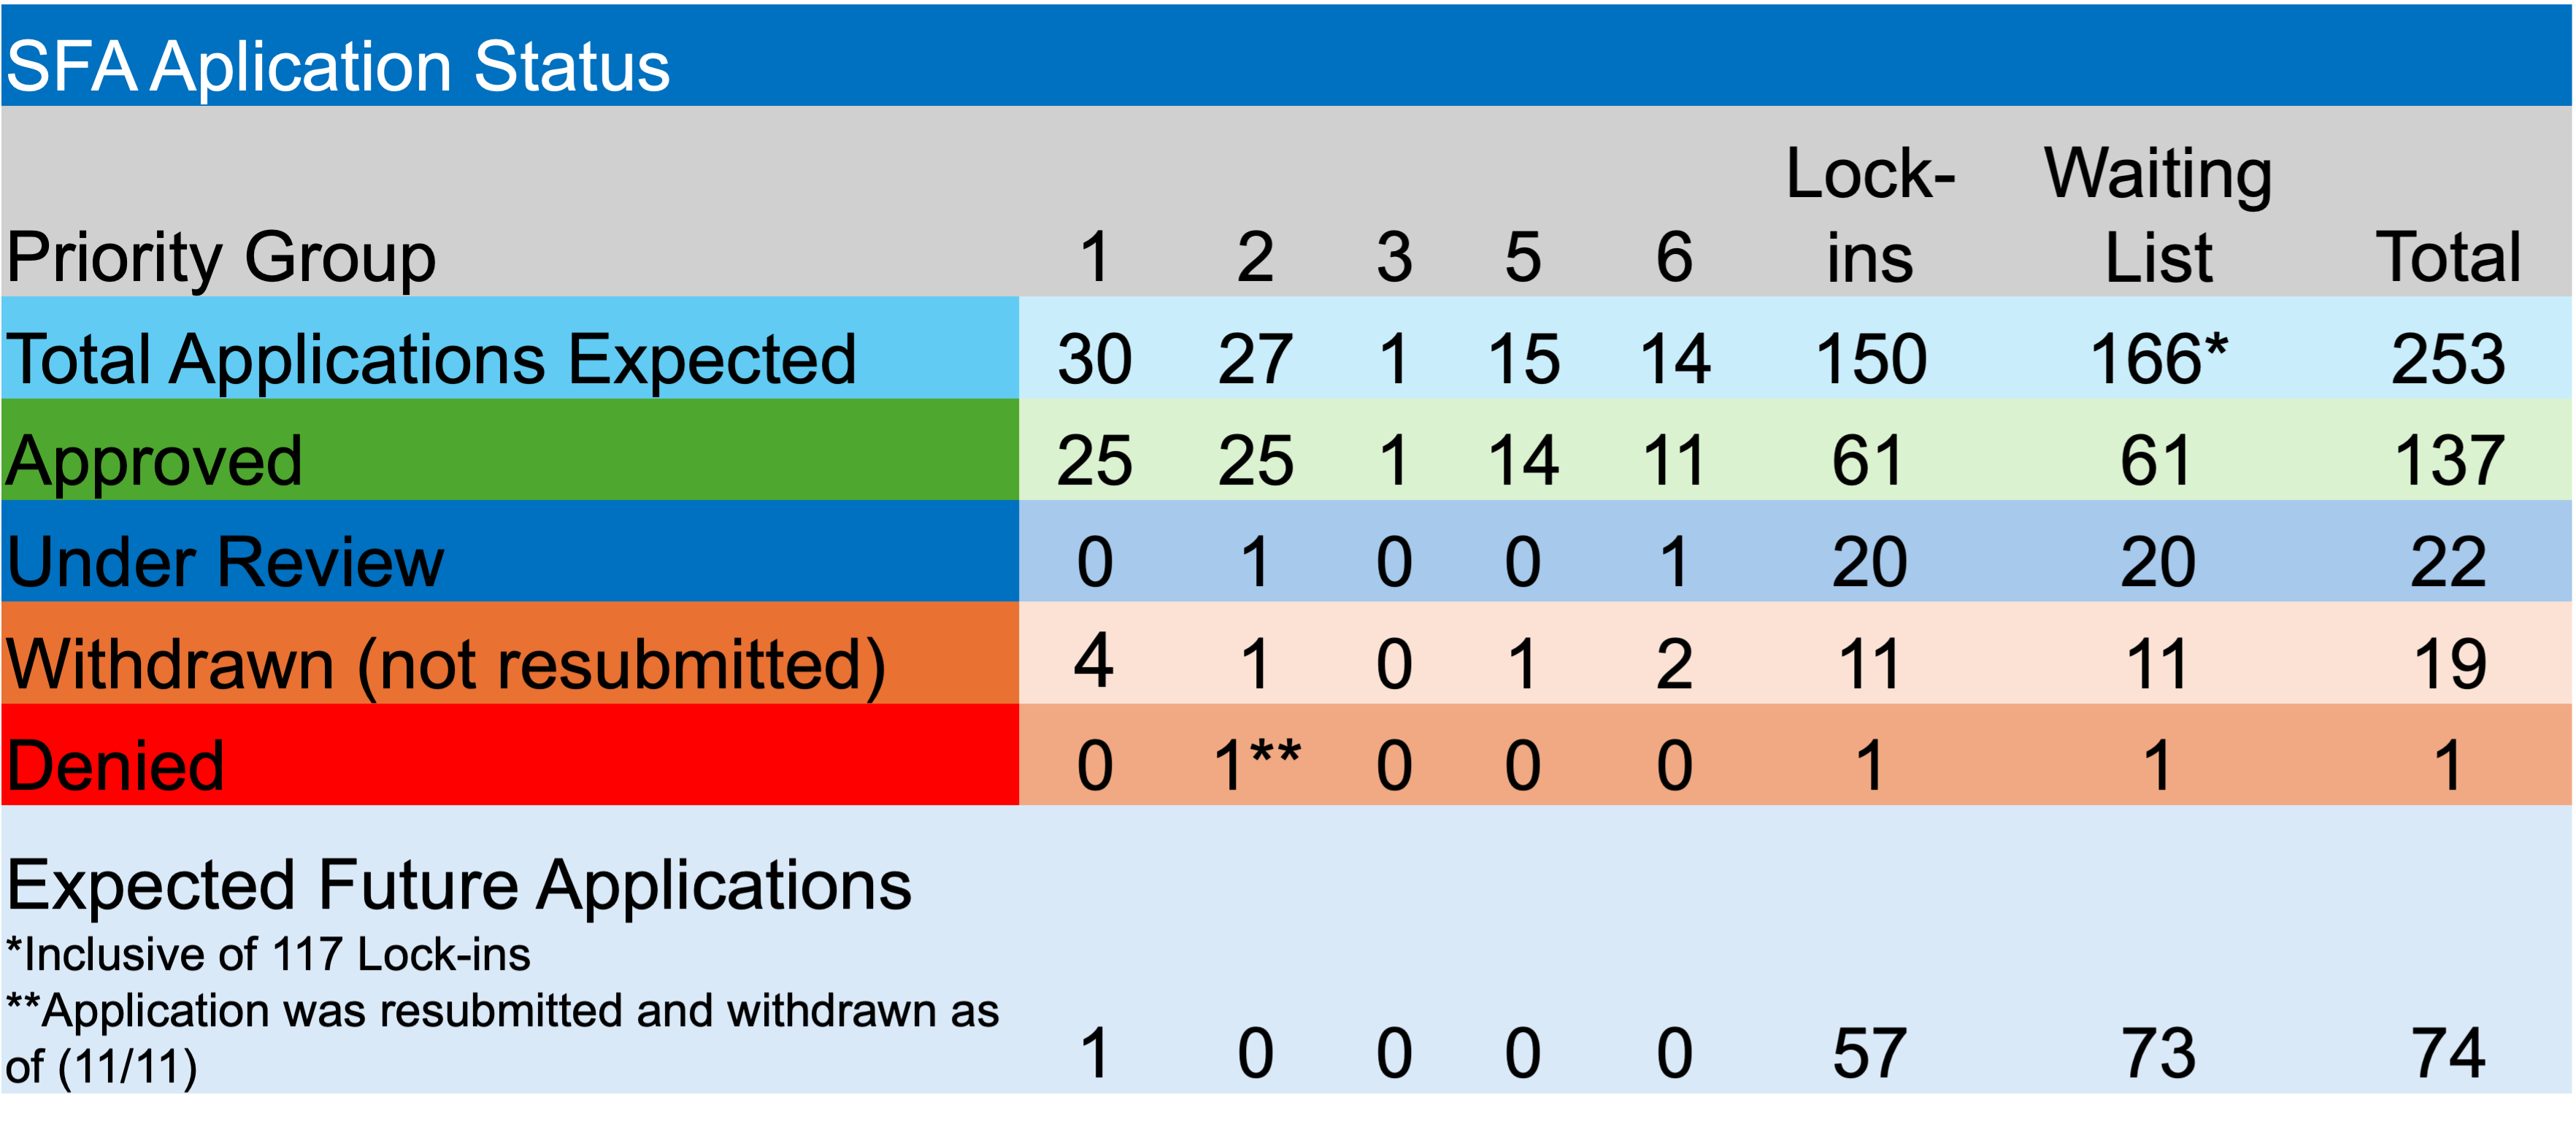
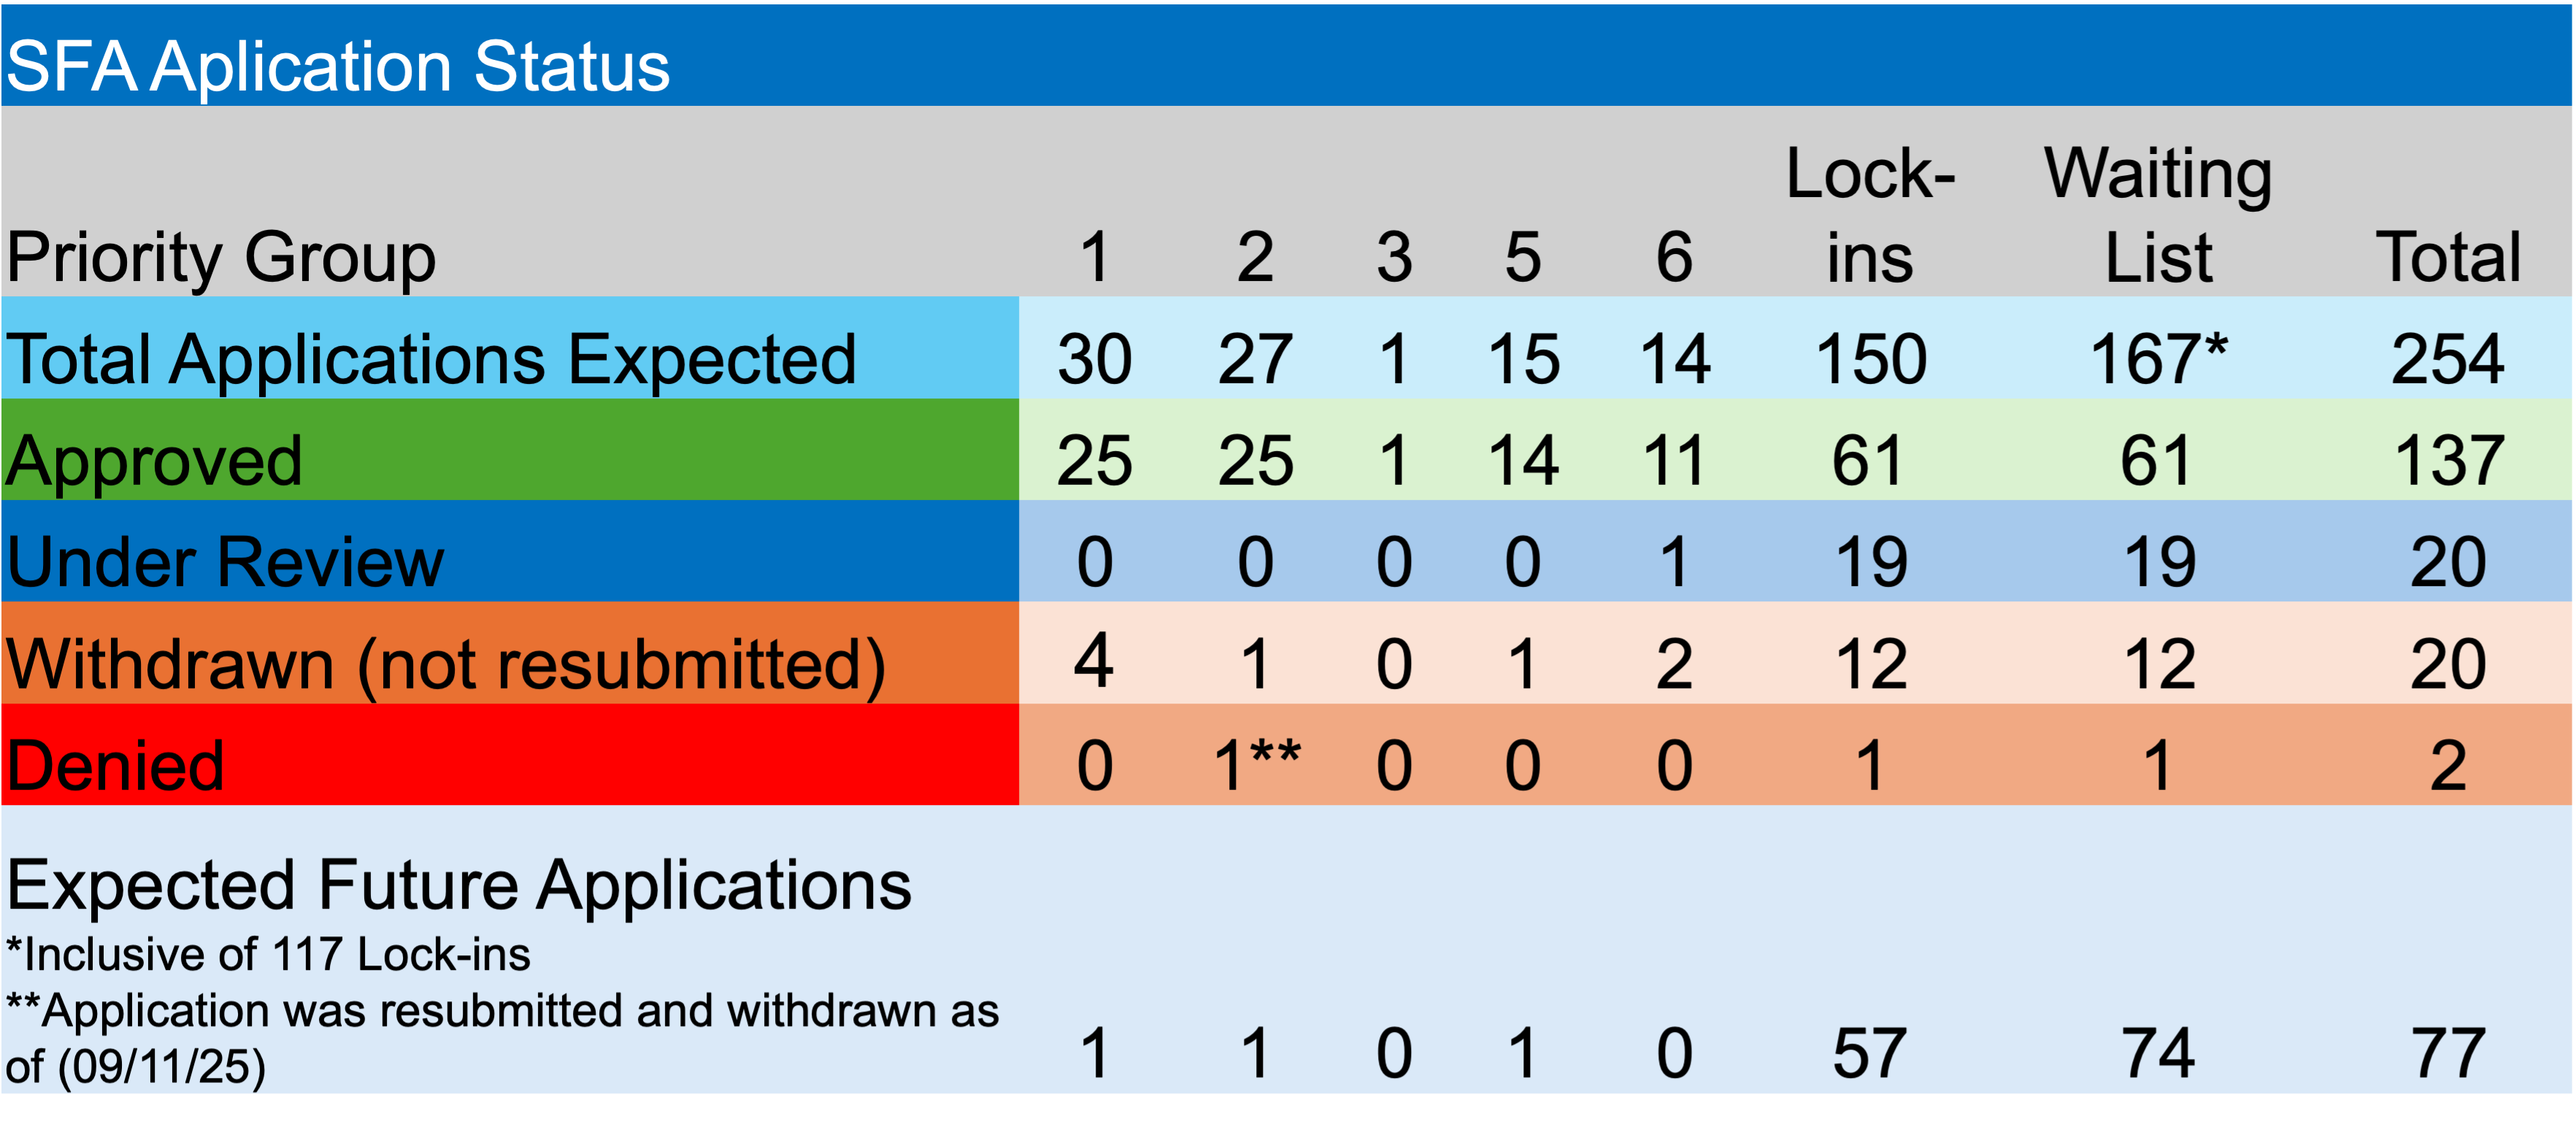
Enough about rates and the Fed. The PBGC is still plugging away on the plethora of applications before them and those yet to be accepted. Currently, there are 20 applications under review. Teamsters Industrial Employees Pension Plan is the latest fund to submit an application seeking SFA. They are hoping to secure $27.4 million for the 1,888 participants. The PBGC has 6-7 applications that must be finalized in each of the next 3 months.
Happy to report that both Alaska Teamster – Employer Pension Plan and Hollow Metal Pension Plan received approval for their applications. The two non-priority pension funds will receive a combined $240.1 million for >13k members.
In other ARPA news, Bakery Drivers Local 550 and Industry Pension Fund, a Priority Group 2 member, whose initial application was originally denied because they were deemed ineligible, has had their revised application denied because of “completeness”. Will three times be the charm? In their latest application they were seeking $125.8 million to support 1,122 plan participants.
Lastly, Greater Cleveland Moving Picture Projector Operators Pension Fund, became the most recent fund added to the waitlist. They are the 167th fund on the waitlist of non-priority members, with 74 still to submit an application. According to the PBGC’s website, their e-Filing portal is limited at this time.
We’ll keep you updated on the activity of the U.S. Federal Reserve and the potential implications from their interest rate decision. Hopefully, concerns related to inflation will offset the current trends related to employment providing future SFA recipients with an environment conducive to defeasing the promised benefits at higher yields and thus, lower costs.