By: Russ Kamp, CEO, Ryan ALM, Inc.
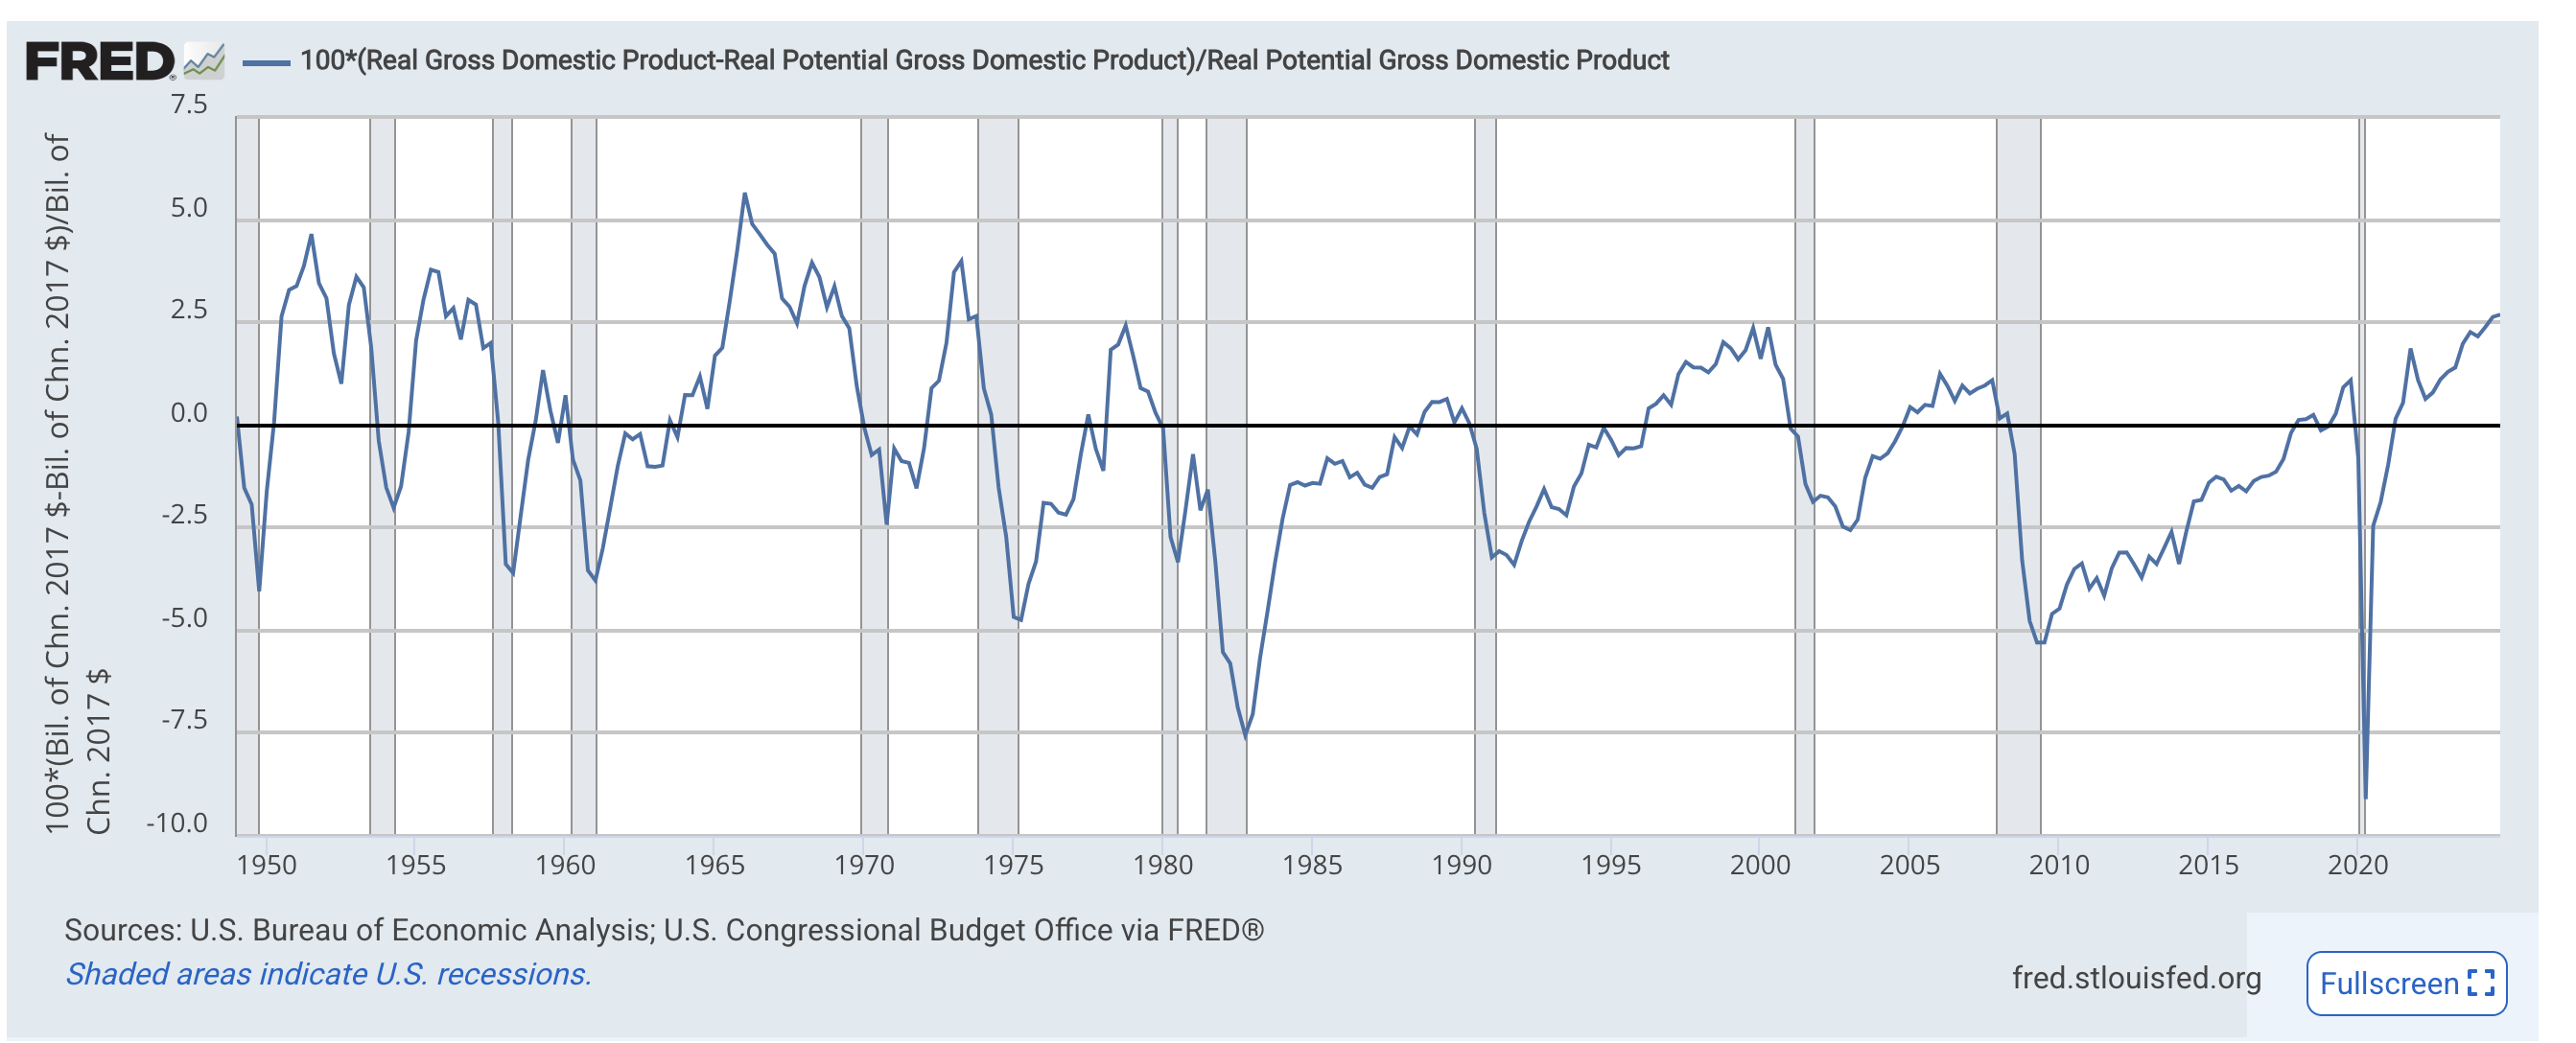
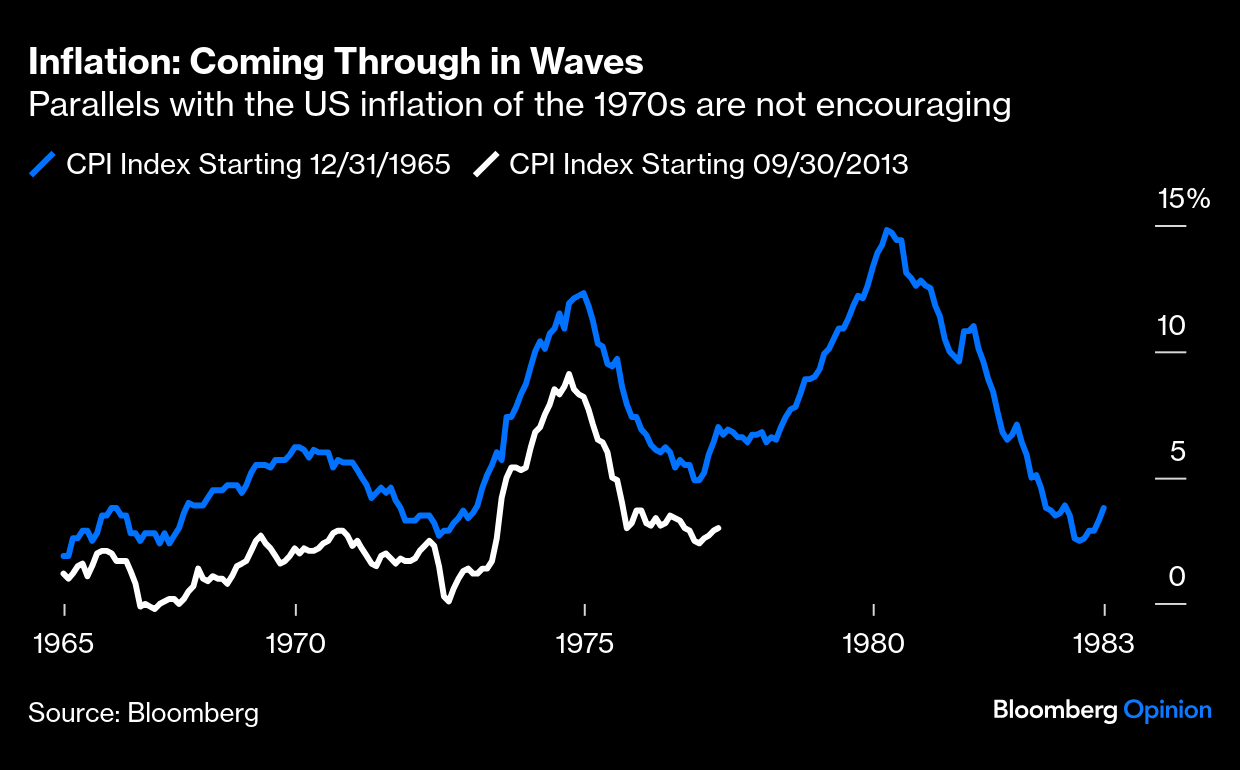
I produced a post recently titled, “Parallels to the 1970s?” in which I discussed the challenging economic environment that existed during the 1970s as a result of two oil shocks and some sketchy decision making on the part of the US Federal Reserve. The decade brought us a new economic condition called stagflation, which was a term coined in 1965 by British politician Lain Macleod, but not widely used or recognized until the first oil embargo in 1973. Stagflation is created when slow economic growth and inflation are evident at the same time.
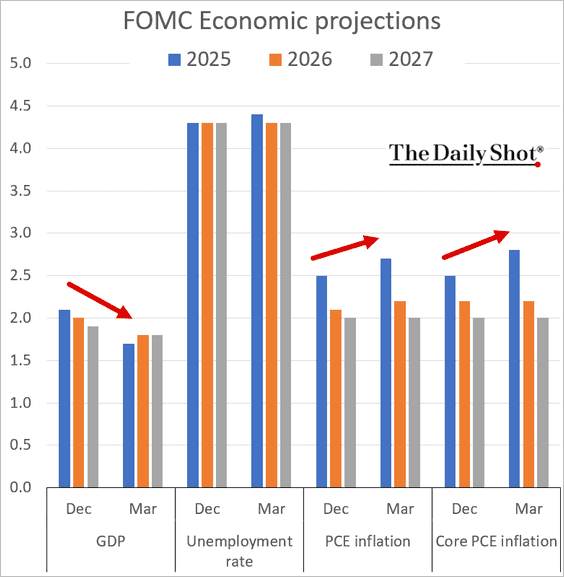
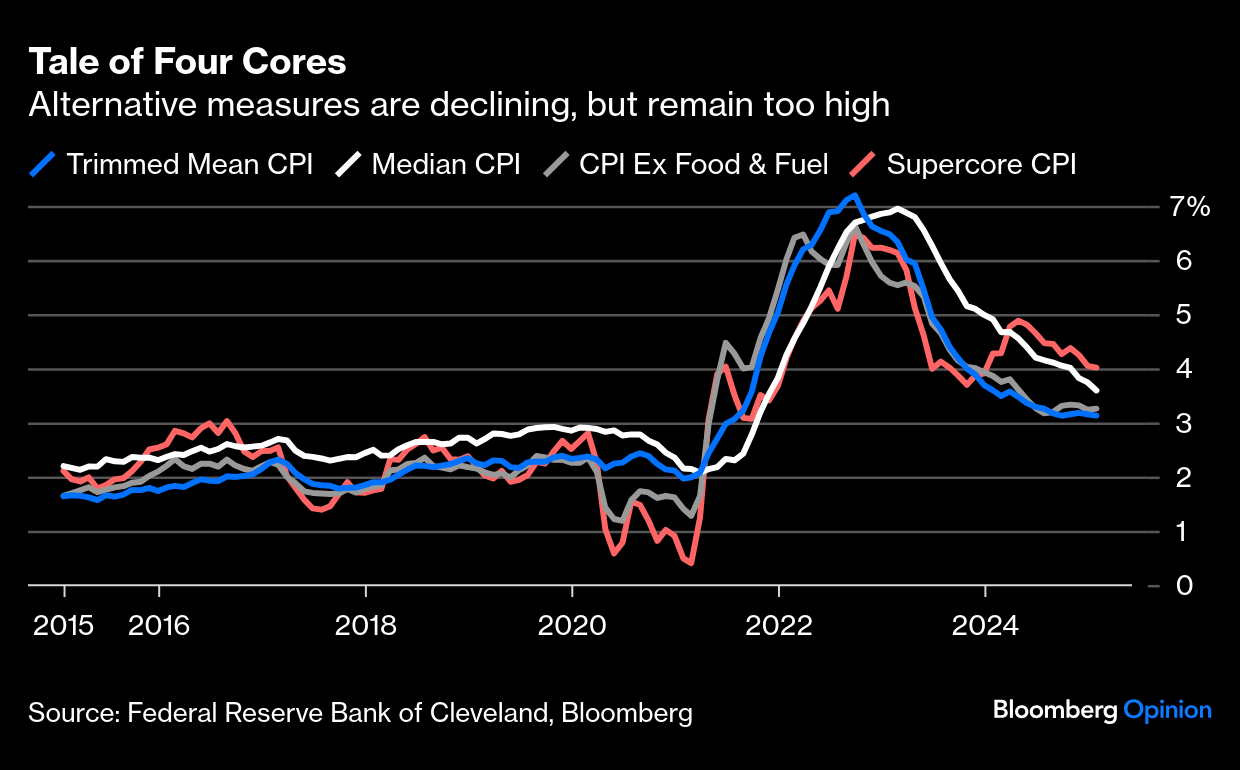
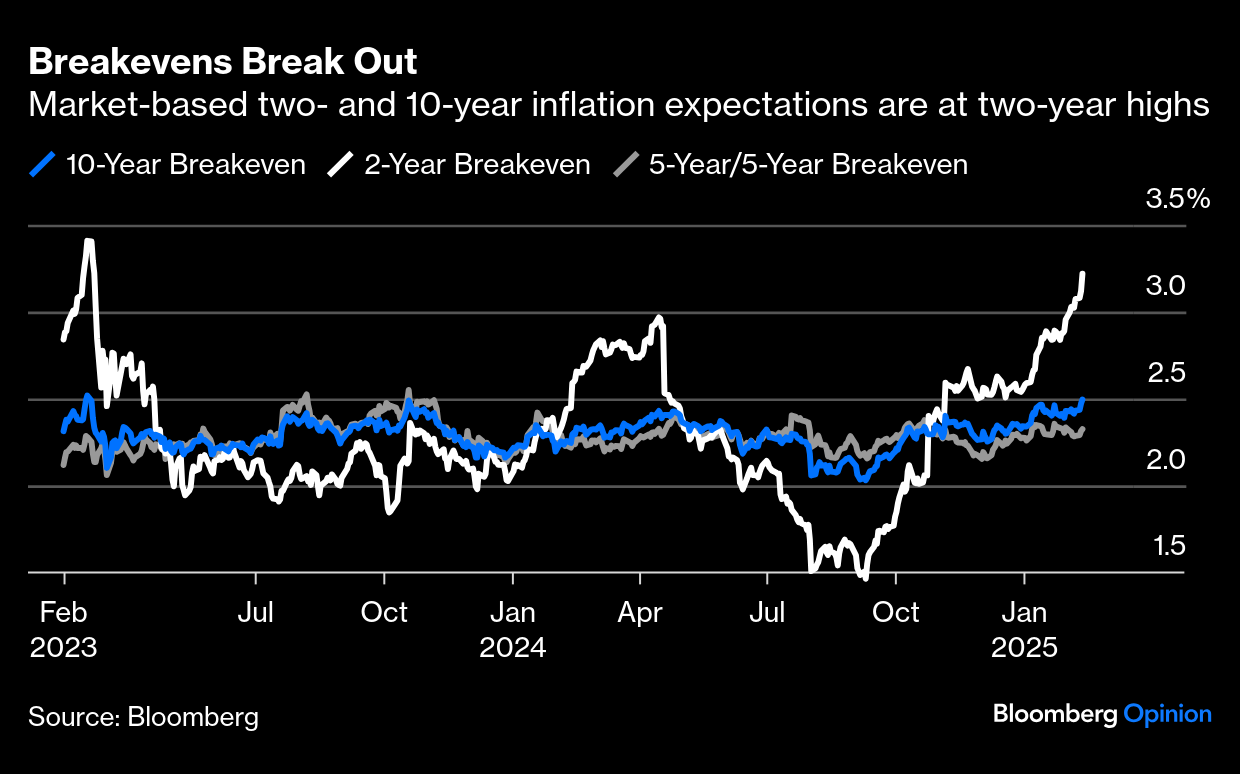
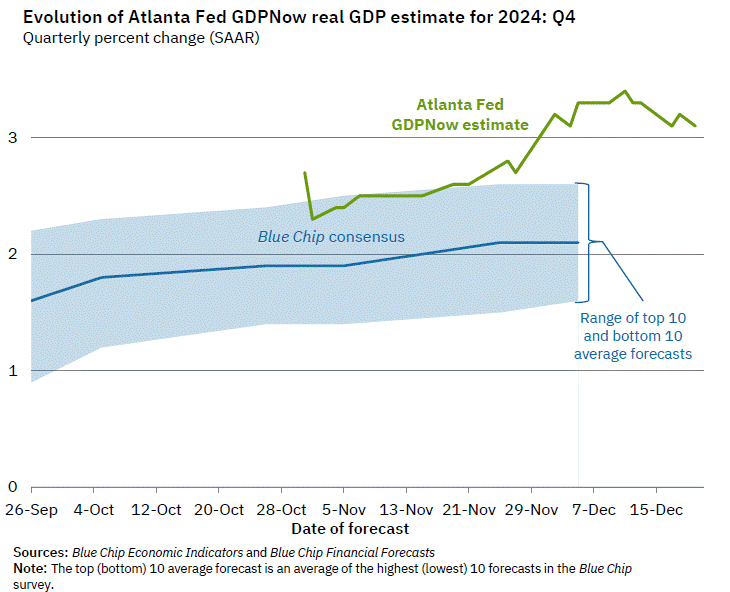
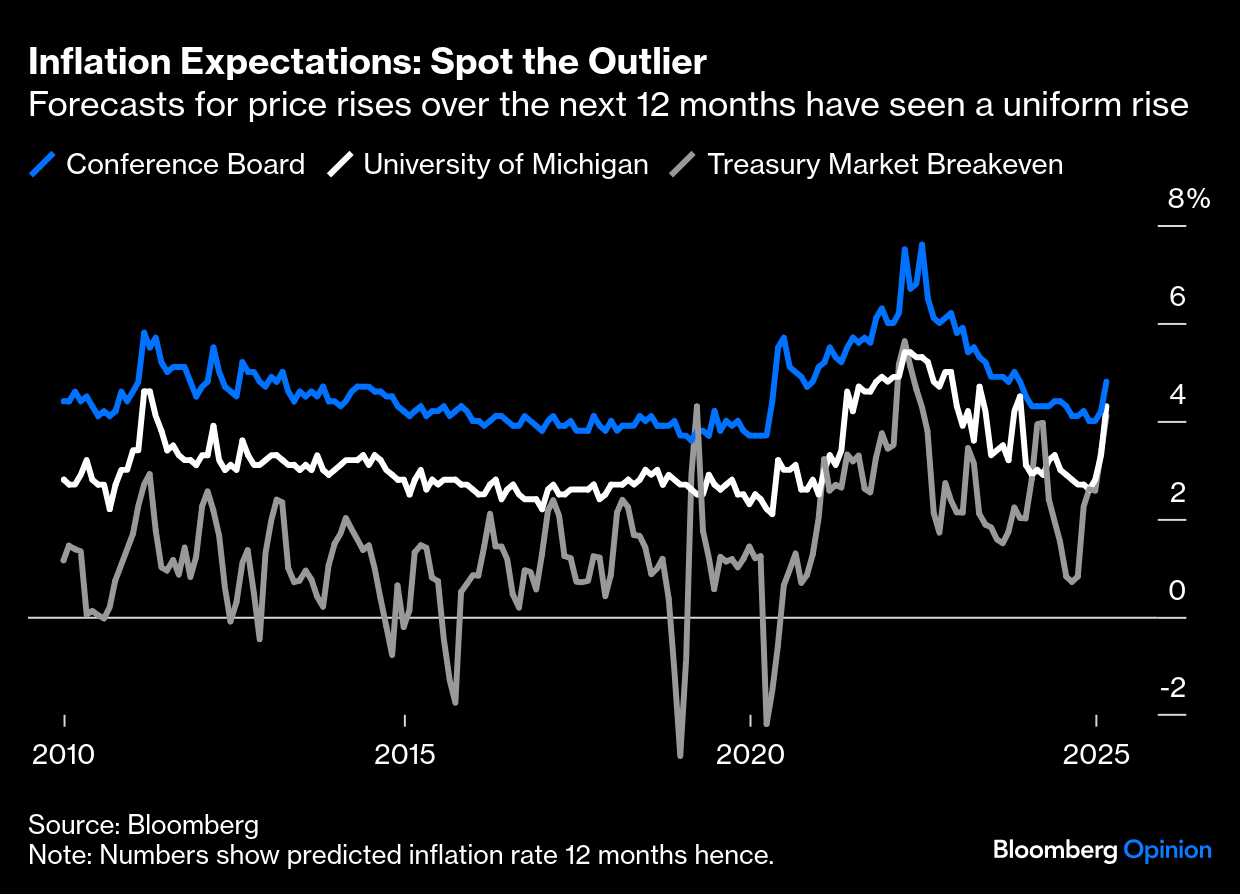
According to the graph above, the FOMC is beginning to worry about stagflation reappearing in our current economy, as they reduced the expectations for GDP growth (the Atlanta Fed’s GDPNow model has Q1’25 growth at -1.8%), while simultaneously forecasting the likelihood of rising inflation. Not good. If you think that the FOMC is being overly cautious, look at the recent inflation forecasts from several other entities. Seems like a pattern to me.
Yet, market participants absorbed the Powell update as being quite positive for both stocks and bonds, as markets rallied soon after the announcement that the FOMC had held rates steady. Why? There is great uncertainty as to the magnitude and impact of tariffs on US trade and economic growth. If inflation does move as forecasted, why would you want to own an active bond strategy? If growth is moderating, and in some cases forecasted to collapse, why would you want to own stocks? Aren’t earnings going to be hurt in an environment of weaker economic activity? Given current valuations, despite the recent pullback, caution should be the name of the game. But, it seems like risk on.
Given the uncertainty, I would want to engage in a strategy, like cash flow matching (CFM), that brought an element of certainty to this very confusing environment. CFM will fully fund the liability cash flows (benefits and expenses) with certainty providing timely and proper liquidity to meet my near-term obligations, so that I was never in a position where I had to force liquidity where natural liquidity wasn’t available. Protecting the funded ratio of my pension plan would be a paramount objective, especially given how far most plans have come to achieve an improved funding status.
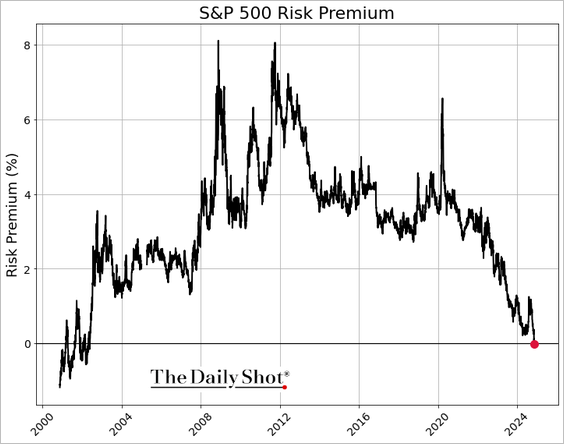
I’ve written on many occasions that the nearly four decades decline in rates was the rocket fuel that drove risk assets to incredible heights. It covered up a lot of sins in how pensions operated. If a decline in rates is the only thing that is going to prop up these markets, I doubt that you’ll be pleased in the near-term. Bifurcate your assets into two buckets – liquidity and growth – and buy time for your pension plan to wade through what might be a very challenging market environment. The FOMC was right to hold rates steady. Who knows what their next move will be, but in the meantime don’t bet the ranch that inflation will be corralled anytime soon.