By: Russ Kamp, Managing Director, Ryan ALM, Inc.
In 1971, David Gates, singer-songwriter for the band Bread, published the song “IF”. The song begins with the lyrics, “If a picture paints a thousand words…”. If David was correct and a picture does in fact paint 1,000 words, then how many words do you think that the picture below is producing? First, I don’t think that you need many words, certainly not 1,000, to know precisely what is being conveyed in the graph below. But, on the other hand, you could probably write 1 million words about the current state of the US equity market, especially large cap stocks, which have performed exceptionally well for the second consecutive year basically on the back of mega technology stocks benefitting from the “promise” of AI.
The S&P 500 has now advanced more than 20% in each of the last two calendar years and four of the last six years. According to Glen Eagle trading, “only three times in history has it done so for a third: 1935-36 (followed by a 39% plunge in 1937), 1954-55 (a 2.6% rise in 1956), and 1995-98 (nearly 20% in 1999)”. But, please don’t forget that the NASDAQ 100 collapsed by more than -80% beginning in March 2000 – 2002. Those stats portend some potentially serious consequences if no action is taken now.
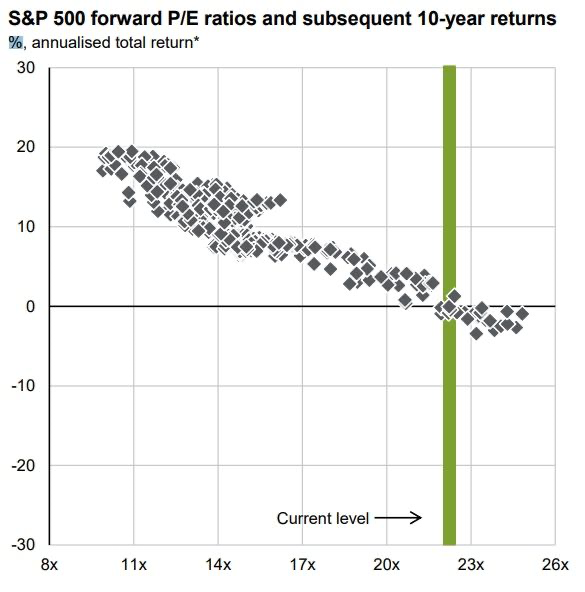
The graph above was produced by Mike Zaccardi, CFA, CMP, who highlights the fact that the current level of the S&P’s forward looking P/E multiple is likely to produce a 10-year annualized return for the S&P 500 that is likely to be negative. If not negative, certainly not robust enough to support US pension plans hoping to generate a roughly 7% annualized return on assets (ROA). That’s the bad news!
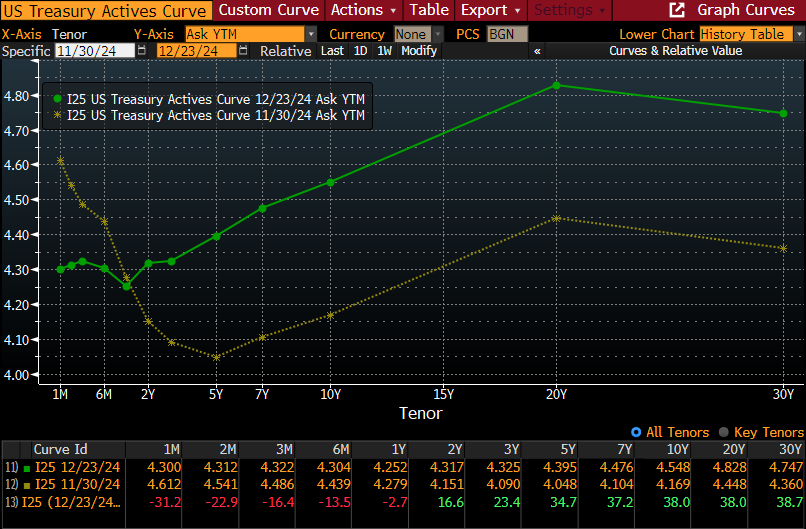
The good news is that there is an alternative to letting the equity exposure ride. As I’ve written about recently, US Treasury bond and note yields have risen to levels last witnessed earlier this year. Comparable maturity investment grade corporate bonds have historically average a roughly 1.2% yield premium. If the average spread were realized (they are tight today), one could get a roughly 5.75%-6.00% YTW with little volatility. Adopt a cash flow matching strategy as the core holding creating a level of certainty that is not possible through a traditional asset allocation framework.
Don’t subject the pension assets to unnecessary risk. Regrettably, periods of significant negative returns are not unheard of and often lead to dramatically increased levels of contributions needed to improve the plan’s funded status. As always, we are more than willing to produce a FREE analysis on what could possibly be achieved through the adoption of a CFM strategy. The time to act is now and not after the S&P 500 suffers a correction.