By: Russ Kamp, Managing Director, Ryan ALM, Inc.
You may not have been following Ryan ALM’s blog through the many years that I have been producing posts in which I’ve touched on this subject. We at Ryan ALM continue to question the logic of focusing on the return on asset assumption (ROA) as the pension plan’s primary objective. We especially challenge the notion that shifting a couple of percent from one asset class to another produces meaningful results for the pension system’s asset allocation and long-term funding success.
Day after day, I read, as I’m sure that you do, articles, blogs, emails, etc. highlighting a new product or twist to an existing one that will just “rock your world” and assist you on the road to achieving the return on asset (ROA) assumption. It doesn’t matter whether your plan is a public fund, multiemployer pension, or a private plan, the continued focus on the ROA as the primary objective for both plan sponsors and their asset consultants is leading everyone down the wrong path. You see, most of the retirement community has been sold a bag of rotten goods claiming that a plan needs to generate the ROA, or it will not meet its funding goals. I say, “Hogwash”! I’d actually like to say something else, but you get my drift.
So, when valuations for most asset classes seem to be stretched, as they do today, where does a pension plan go to allocate their plan’s assets? Well, this “issue” has plan sponsors once again scratching their collective heads and doing the Curly shuffle. You see, they have once again through the presumed support of their consultants, begun to approach asset allocation as nothing more than rearranging the deck chairs on the Titanic.
Despite tremendous gains from both equity and fixed income bull markets, these plans are willing to “let it ride” instead of altering their approach to possibly reduce risk, stabilize the funded status, and moderate contribution expense. Can you believe that one of the country’s largest public plans has recently decided (I’m sure that it took a long time, too) to roll back fixed income exposure by 2% and equity exposure by 1% from 55% to 54%? Are you kidding me? Is that truly meaningful or heroic?
Please note that generating a return commensurate with the ROA is not going to guarantee success. Furthermore, since most public pension plans are currently underfunded on an actuarial basis (let alone one based on market values) meeting this ROA objective will only further exacerbate the UAAL, as the funded status continues to slip. You see, if your plan is 80% funded, and that is the “average” funded ratio based on Milliman’s latest work, you need to outperform your plan’s 7% ROA objective by 1.75% in order to maintain the current funded status. Here’s a simple example as a proof statement:
Assets = $80 Liabilities = $100 ROA = 7.00% Asset growth = $5.60 Liability growth = $7.00
In order for asset growth = $7.00, assets would need a 8.75% ROA
Given that reality, these plans don’t need the status quo approach that has been tried for decades. Real pension reform must be implemented before these plans are no longer sustainable, despite the claim that they are perpetual. As an industry, we have an obligation to ensure the promised benefits are there when needed. Doing the same old, same old places our ability to meet this responsibility in jeopardy. If valuations are truly stretched, don’t leave your allocations basically stagnant. Take the opportunity to try something truly unique.
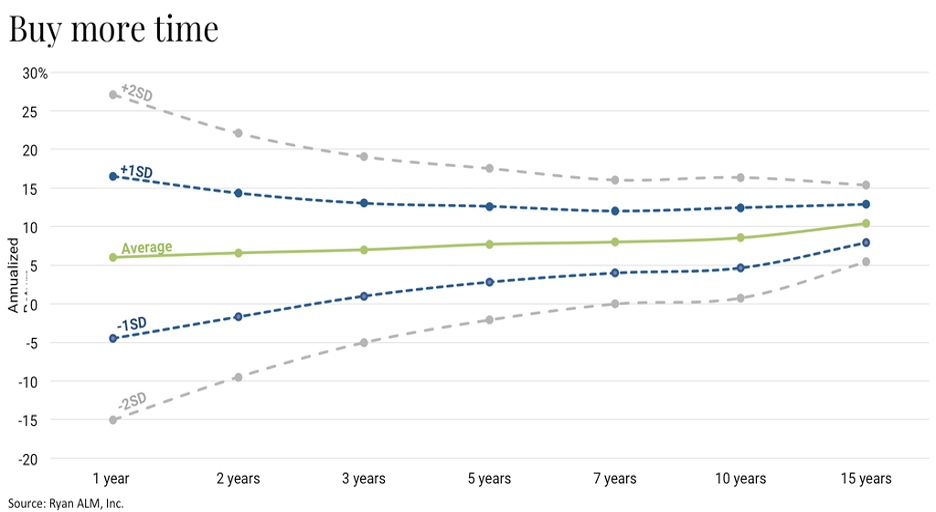
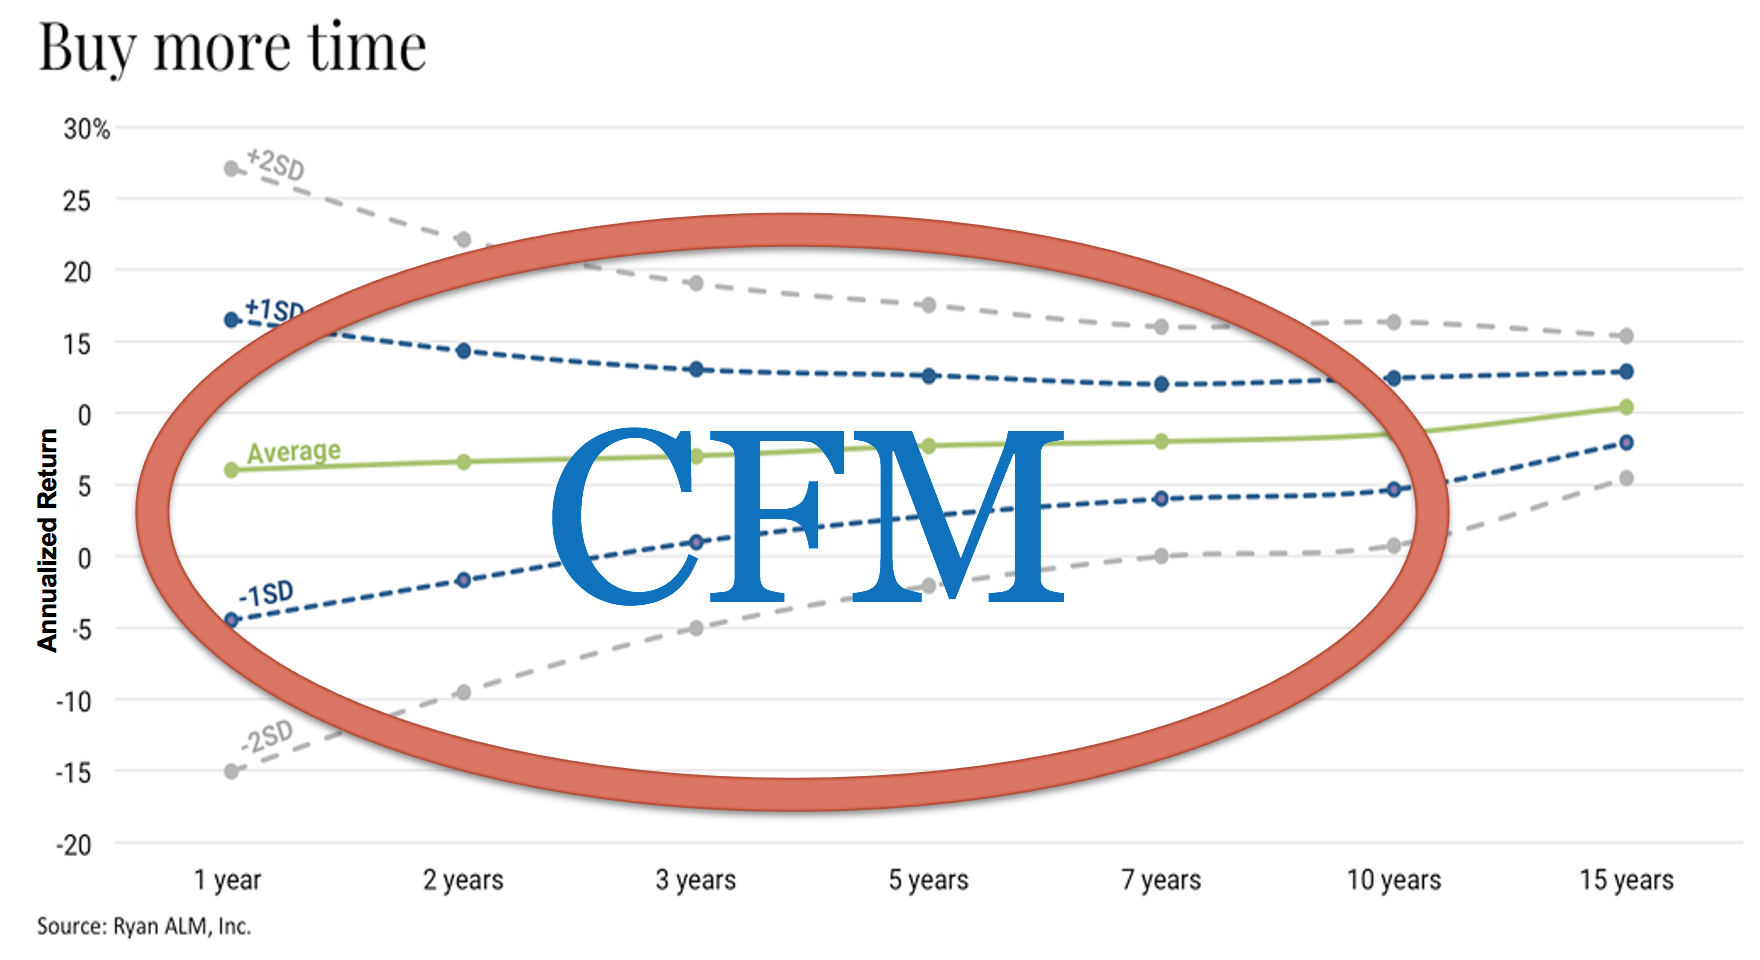
It is time to approach asset allocation with a renewed focus. Instead of having all of your plan’s assets tied to achieving the ROA, divide them into two buckets – liquidity and growth. The liquidity bucket will utilize a cash flow matching (CFM) strategy to ensure that monthly payments of benefits and expenses (B+E) are available, as needed, chronologically. The asset cash flows from the CFM strategy will be carefully matched against the liability cash flows of B+E providing the necessary liquidity. This provides the growth bucket (all non-bond assets) with an extended investing horizon, and we all know how important a long time horizon is for investing. Importantly, the growth assets will be used down the road to meet future pension liabilities and not in the short-term to meet liquidity needs. The practice of a cash sweep to meet ongoing liquidity has negatively impacted long-term returns for many pension systems. Let bonds fund B+E so the growth assets can grow unencumbered.
Focusing on products and minor asset class shifts will waste a lot of your time and not produce the results that our pension plans need. Ensuring the appropriate funding to meet the promises given to the plan participant takes real reform. It starts with eliminating the single focus on the ROA. Pension plan liabilities need to be invited to the asset allocation dance, since paying a benefit is the only reason that the fund exists in the first place.