By: Russ Kamp, Managing Director, Ryan ALM, Inc.
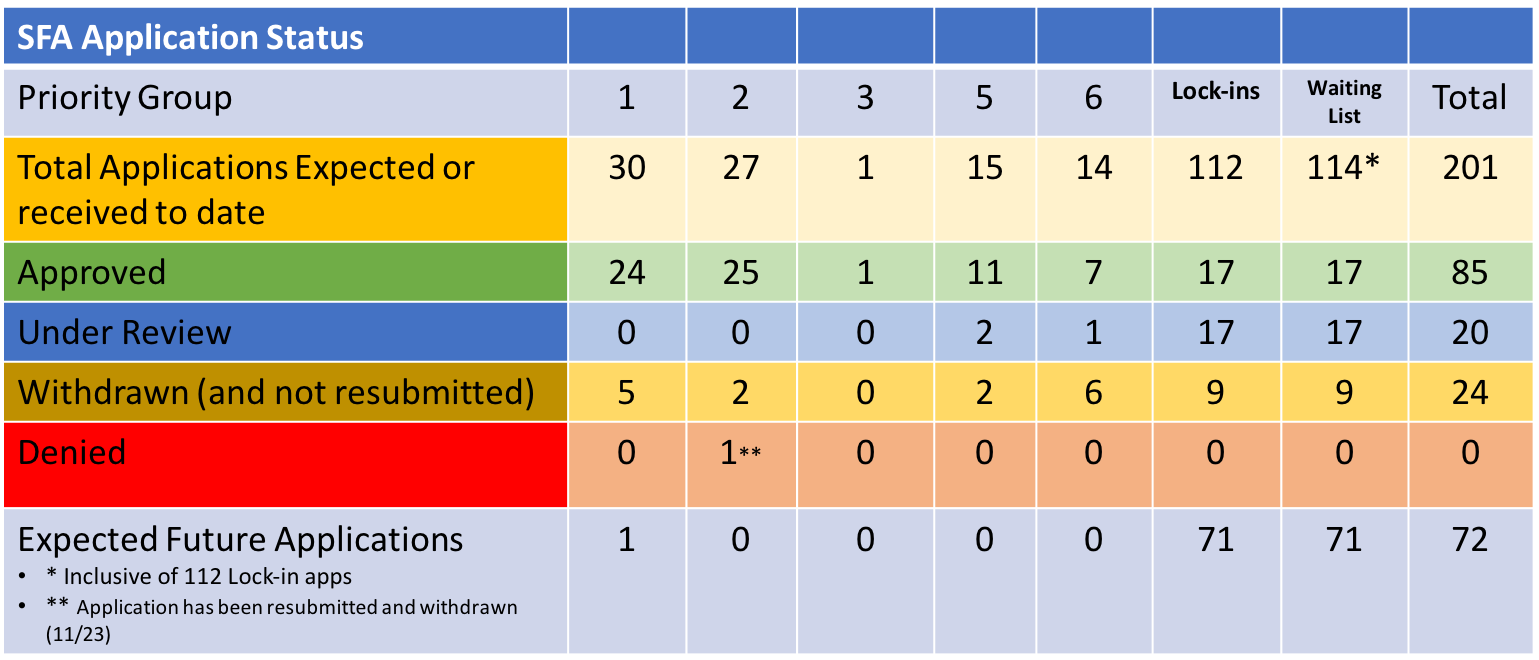
The “dog days” of summer don’t seem to be impacting the activity level at the PBGC, as we had a plethora of activity last week. As mentioned on the PBGC website, the e-filing website is open, but limited. “The e-Filing Portal is open only to plans at the top of the waiting list that have been notified by PBGC that they may submit their applications. Applications from any other plans will not be accepted at this time.” That’s interesting, as there are still 16 pension plans in Priority Groups 1-6 that have potential applications that are not currently being reviewed. Are they excluded, too?
During the week, three funds that had been on the waitlist submitted applications, including, Local 810 Affiliated Pension Plan, the Upstate New York Engineers Pension Fund, and the Alaska Plumbing and Pipefitting Industry Pension Plan. They are seeking a total of $282.1 million for the 9,620 plan participants. This is each plan’s initial submission. As always, the PBGC has 120 from the filing date to conclude the review.
In other news, two plans received approval of their applications, including the Pension Plan of the Moving Picture Machine Operators Union Local 306, a Priority Group 5 member, and the New England Teamsters Pension Plan, that was a Priority Group 6 member. The Moving Picture machinists will receive $20.7 million to support its 542 members, while the NE Teamsters get a whopping $5.7 billion for just over 72k participants. With these latest approvals, the PBGC has now granted through ARPA $67.7 billion in Special Financial Assistance (SFA) that will support the financial futures of 1.34 million American retirees.
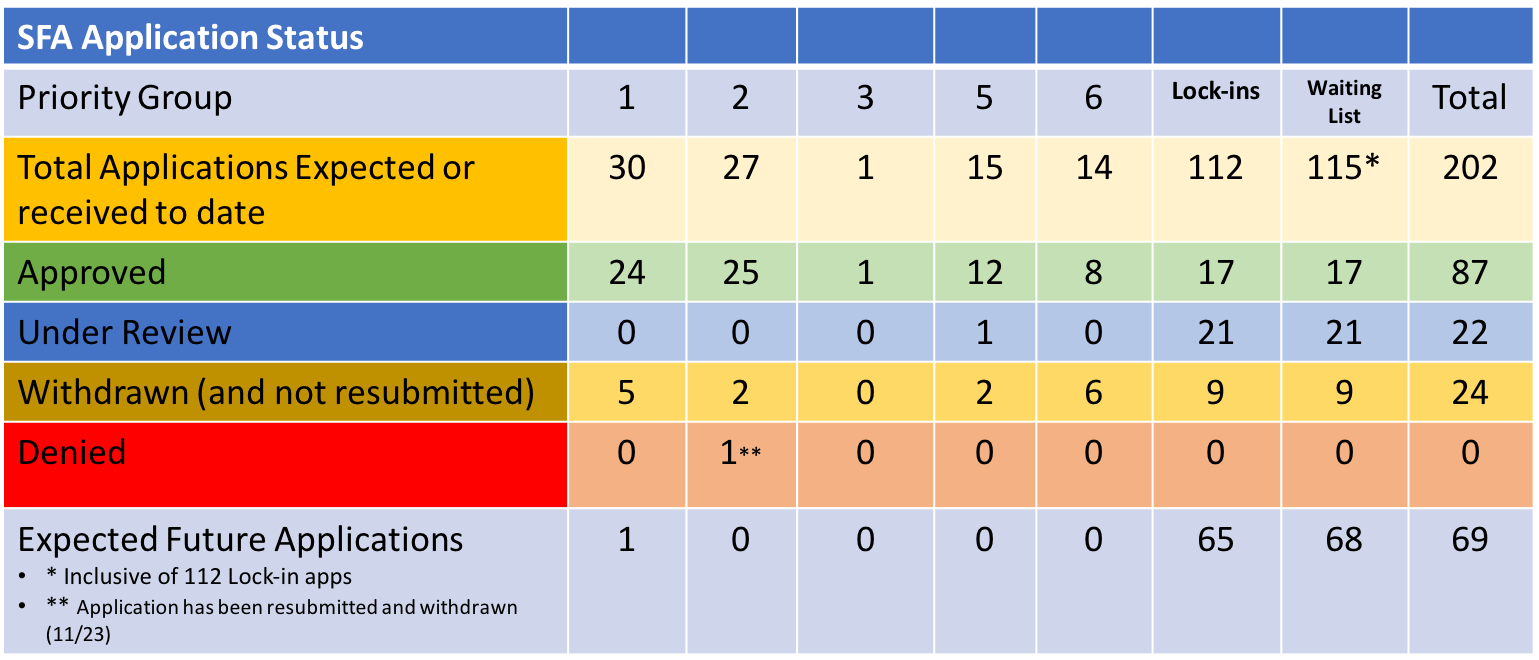
On July 23, the Production Workers Pension Plan was added to the waitlist, becoming the 115th member on that list, with 47 having seen some activity (approved, under review, or withdrawn) regarding their applications. In other news, there were no applications denied or withdrawn. Furthermore, none of the previous SFA recipients were asked to repay a portion of the grant due to overpayment. Have a great week, and don’t hesitate to reach out to us if we can provide any assistance to you as you think through your investment strategy as it relates to the SFA grant.