By: Russ Kamp, CEO, Ryan ALM, Inc.
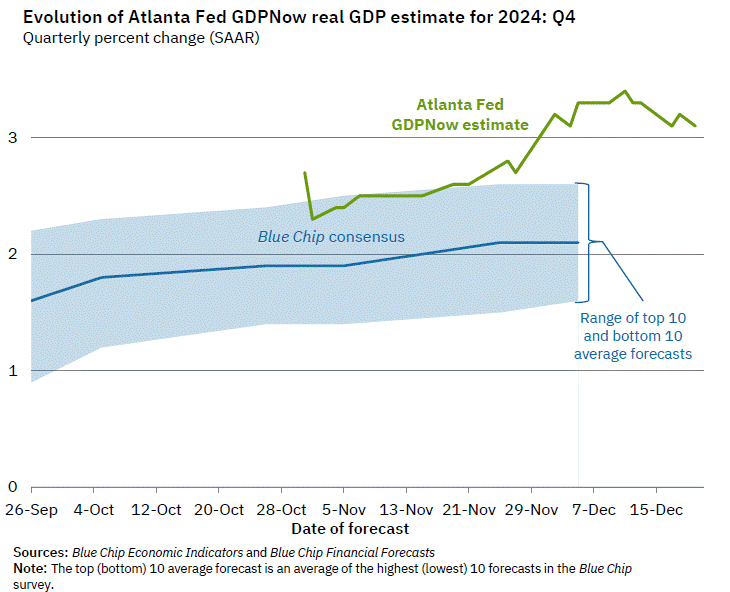
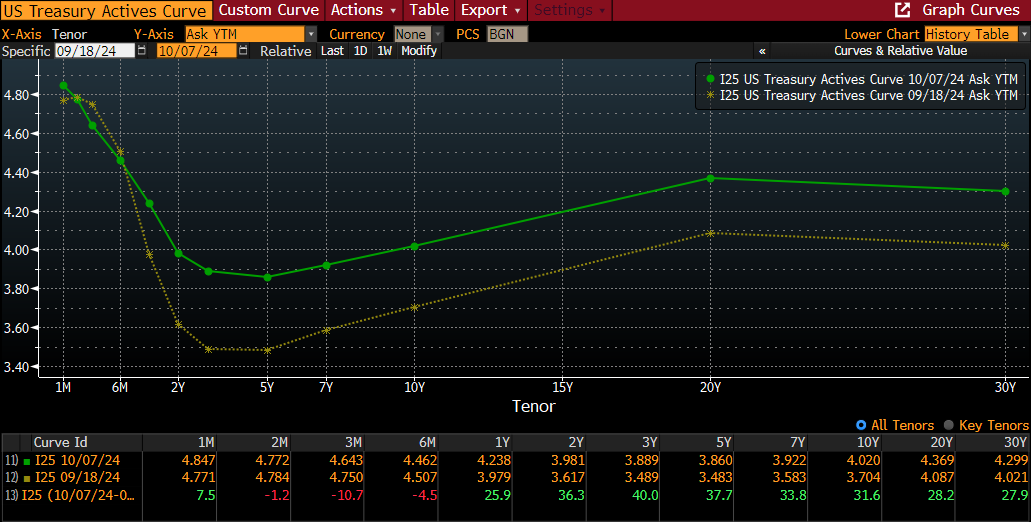
Yesterday’s financial news delivered an inflation surprise (0.5% vs. 0.3%), at least to me and the bond market, if not to the U.S. equity market. The Federal reserve had recently announced a likely pause in their rate reduction activity given their concerns about the lack of pace in the inflation march back to its 2% target. This came on the heels of “Street” expectations after the first 0.5% cut in the FFR that there were “likely” to be eight (8!) interest rate cuts by the summer of 2025. Oh, well, the two cuts that we’ve witnessed since that first move last September may be all we get for a while. “Ho hum” replied the U.S. stock market.
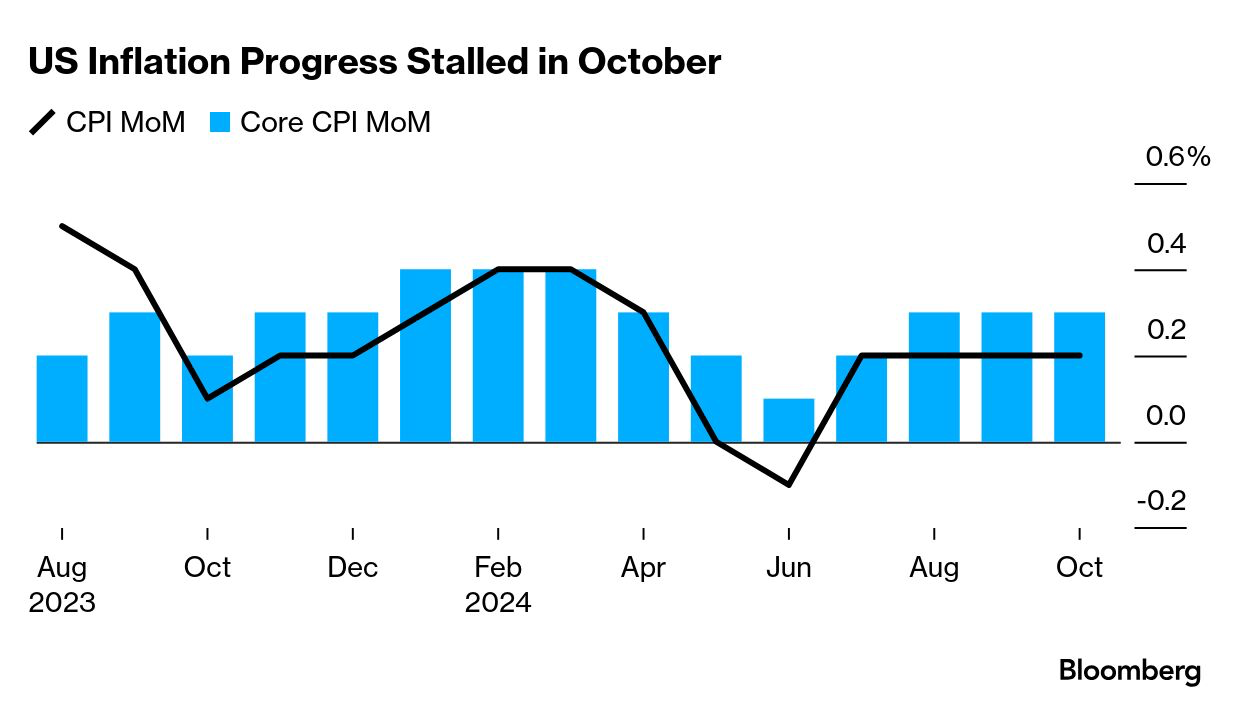
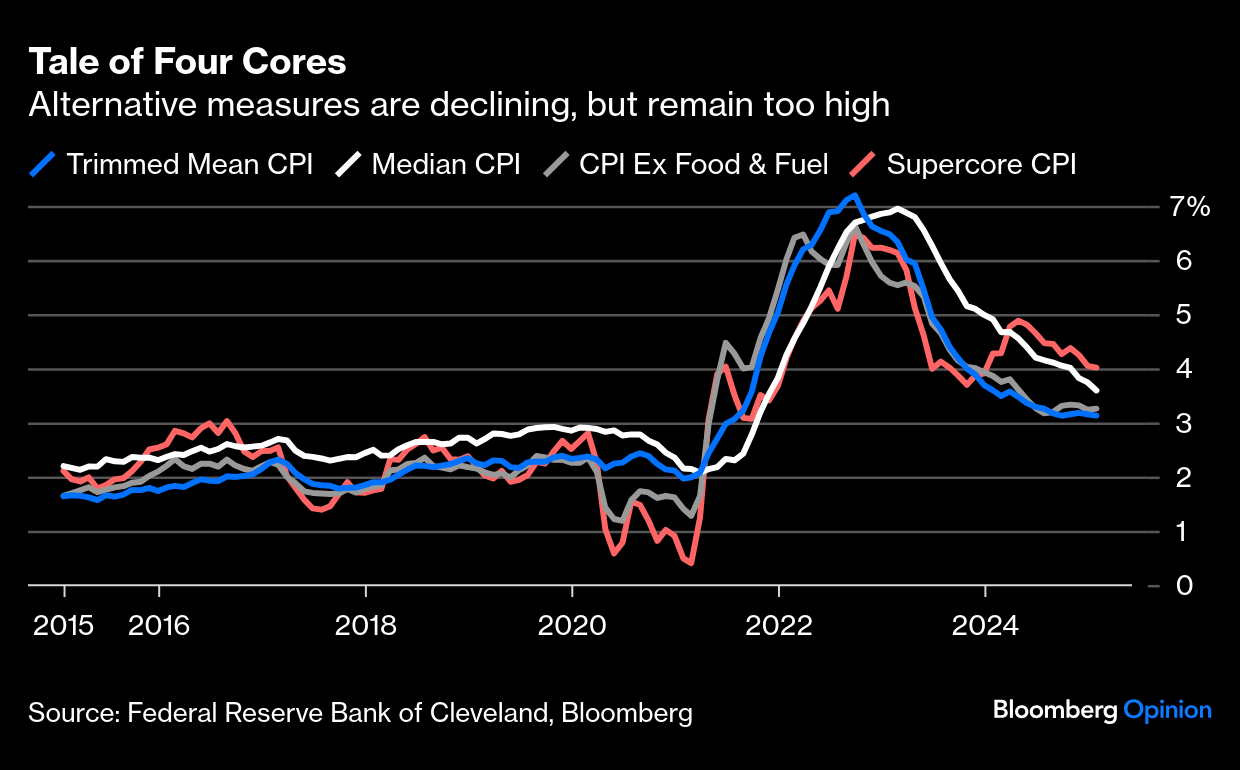
The discounting of yesterday’s inflation release is pretty astounding. Like you, I’ve read the financial press and the many emails that have addressed the CPI data 52 ways to Sunday. Much of the commentary proclaims this data point as a one-off event. For instance, the impact of egg price increases (13.8% last month alone) is temporary, as bird flu will be contained shortly. Seasonal factors impacting “sticky-priced” products tend to be announced in January. I guess those increases shouldn’t matter since they only impact the consumer in January. As a reminder, Core inflation (minus food and energy) rose from 3.1% to 3.3% last month. That seems fairly significant, but we are told that the other three core readings were down slightly, so no big deal. Again, really? Each of those core measures are >3% or more than 1% greater than the Fed’s target.
Then there are those that say, “what is significant about the Fed’s 2% inflation objective anyway”? It is an arbitrary target. Well, that may be the case, but for the millions of Americans that are marginally getting by, the difference between 2% and 3% inflation is fairly substantial, especially when we come up with all of these measures that exclude food, energy, housing (shelter), etc. Are you kidding?
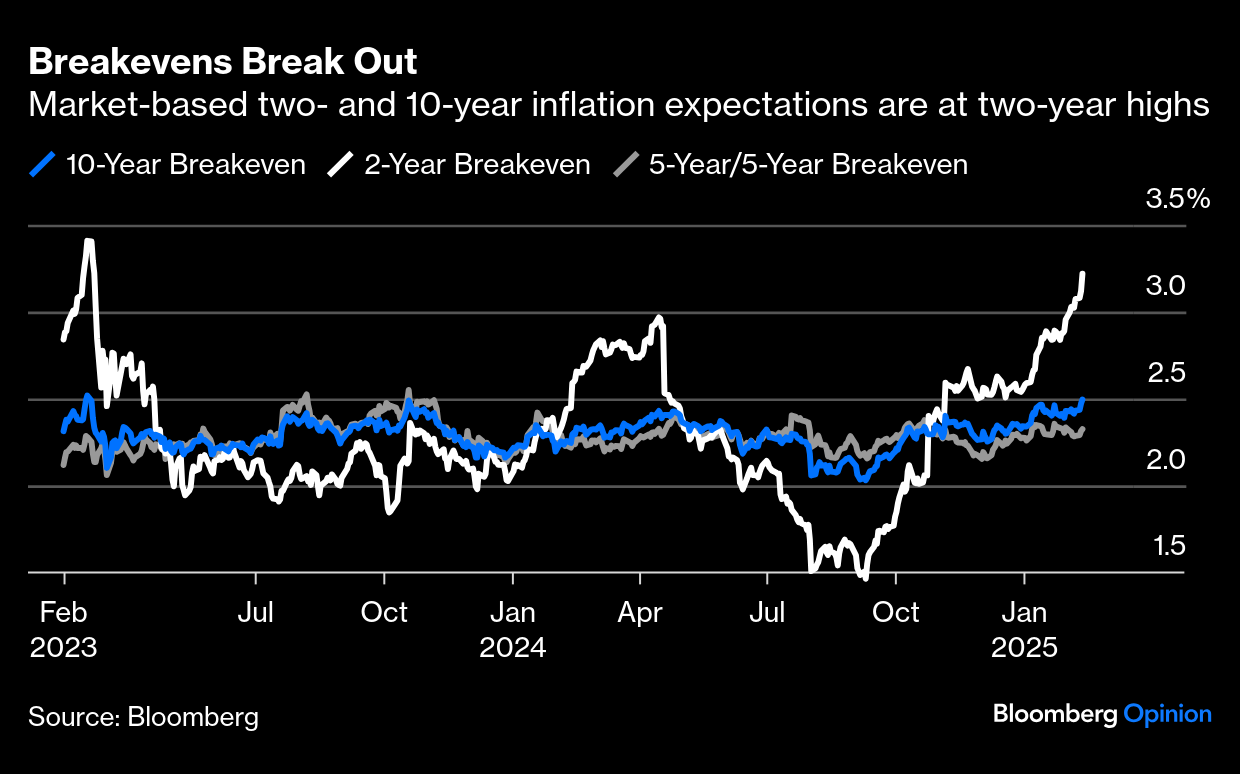
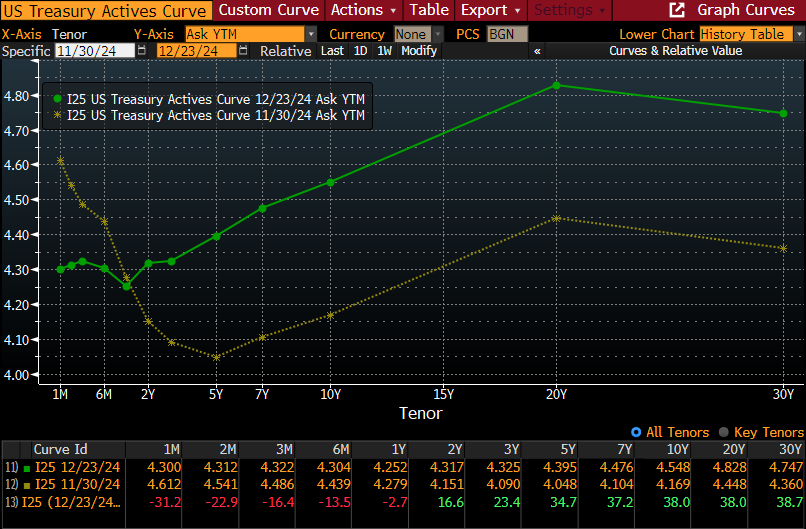
As mentioned previously, expectations for a massive cut in interest rates due to the perception that inflation was well contained have shifted dramatically. Just look at the graph above (thanks, Bloomberg). Following the Fed’s first FFR cut of 50 bps, inflation expectations plummeted to below 1.5% for the two-year breakeven. Today those same expectations reveal a nearly 3.5% expectation. Rising inflation will certainly keep the Fed in check at this time.
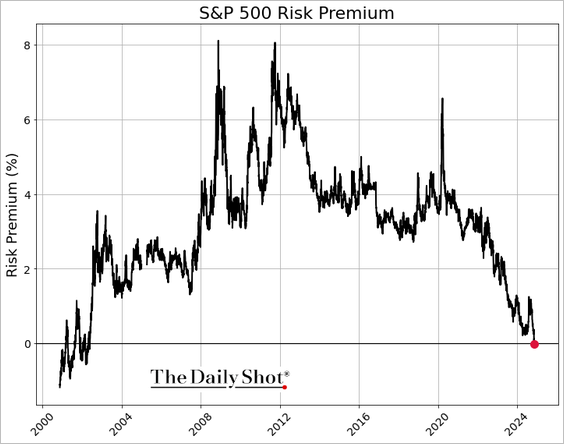
As mentioned earlier in this post, U.S. equities shrugged off the news as if the impact of higher inflation and interest rates have no impact on publicly traded companies. Given current valuations for U.S. stocks, particularly large cap companies, any inflation shock should send a shiver down the spines of the investing community. Should interest rates rise, bonds will surely become a more exciting investment opportunity, especially for pension plans seeking a ROA in the high 6% area. How crazy are equity valuations? Look at the graph below.
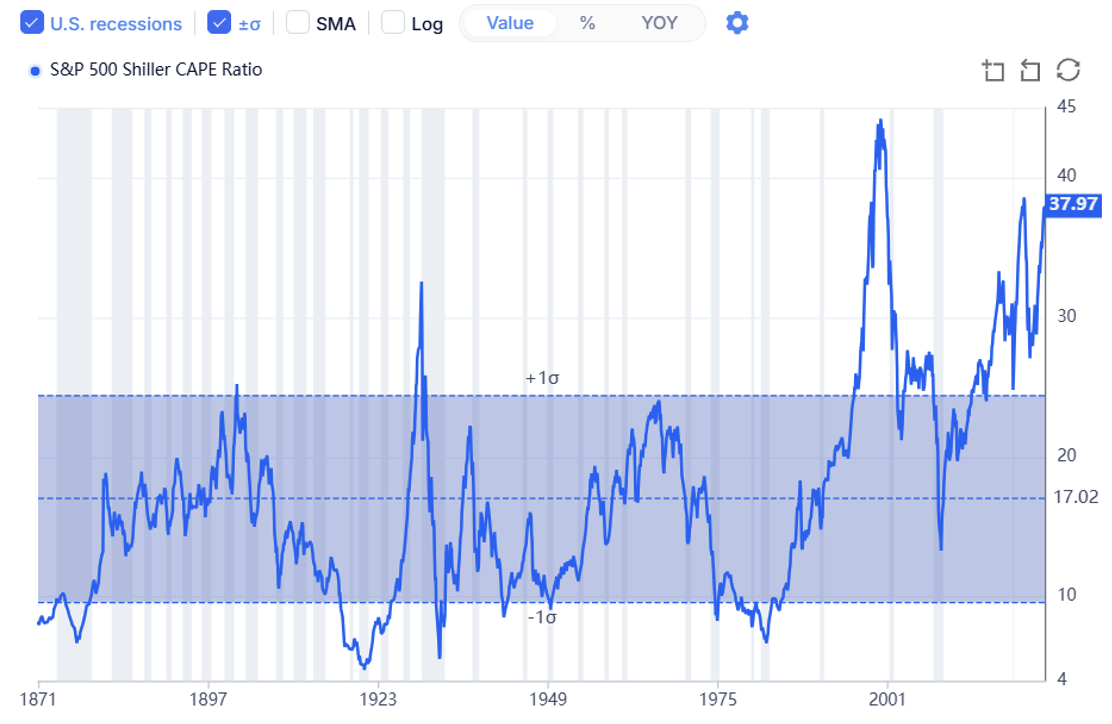
The current CAPE reading has only been greater during the late 1990s and we know what happened as we entered 2000. The bursting of the Technology bubble wasn’t just painful for the Information Technology sector. All stocks took a beating. Should U.S. interest rates rise as a result of the current inflationary environment, there is a reasonable (if not good) chance that equities will get spanked. Why live with this uncertainty? It is time to get out of the game of forecasting economic activity. Why place a bet on the direction of rates? Why let your equity “winnings” run? As a reminder, managing a DB pension plan should be all about SECURING the promised benefits at a reasonable cost and with prudent risk. Is maintaining the status quo prudent?