What is the PCE Price Index Telling Us?

By: Russ Kamp, CEO, Ryan ALM, Inc.

As most investors know, the Federal Reserve’s primary inflation measure is the Core Personal Consumption Expenditures (PCE) price index. The Federal Open Market Committee (FOMC) targets 2% annual PCE inflation while trying to balance long-term price stability and maximum employment. The PCE is produced by the Department of Commerce. Why the PCE? The PCE inflation index covers broad household spending and importantly it adjusts for shifts in consumer behavior, unlike fixed-basket indexes, such as the Consumer Price Index (CPI). Furthermore, the PCE reflects actual expenditures economy-wide and updates the index weights more dynamically. The goal of the PCE inflation measure is to help gauge underlying trends in the broader economy.

The most recent PCE inflation data was published as of today, March 13, 2026, covering a period through January 2026. Core PCE (excluding food and energy) ticked up to 3.06% in January 2026, after having touched 3% at year-end. Cleary, this reading remains well above the Fed’s 2% target, reflecting persistent underlying pressures that may become even more dramatic with the 41% increase per barrel of WTI registered since the close on Friday, February 27th.

The PCE inflation measure has recently accelerated while CPI cooled primarily due to differences in housing weights (lower in PCE) and consumer behavior adjustments.

MonthHeadline PCE (%)Core PCE (%)Headline CPI (%)Core CPI (%)
Dec 20252.93.02.72.9
Jan 20262.93.12.42.5
Feb 2026 (est)??2.4?

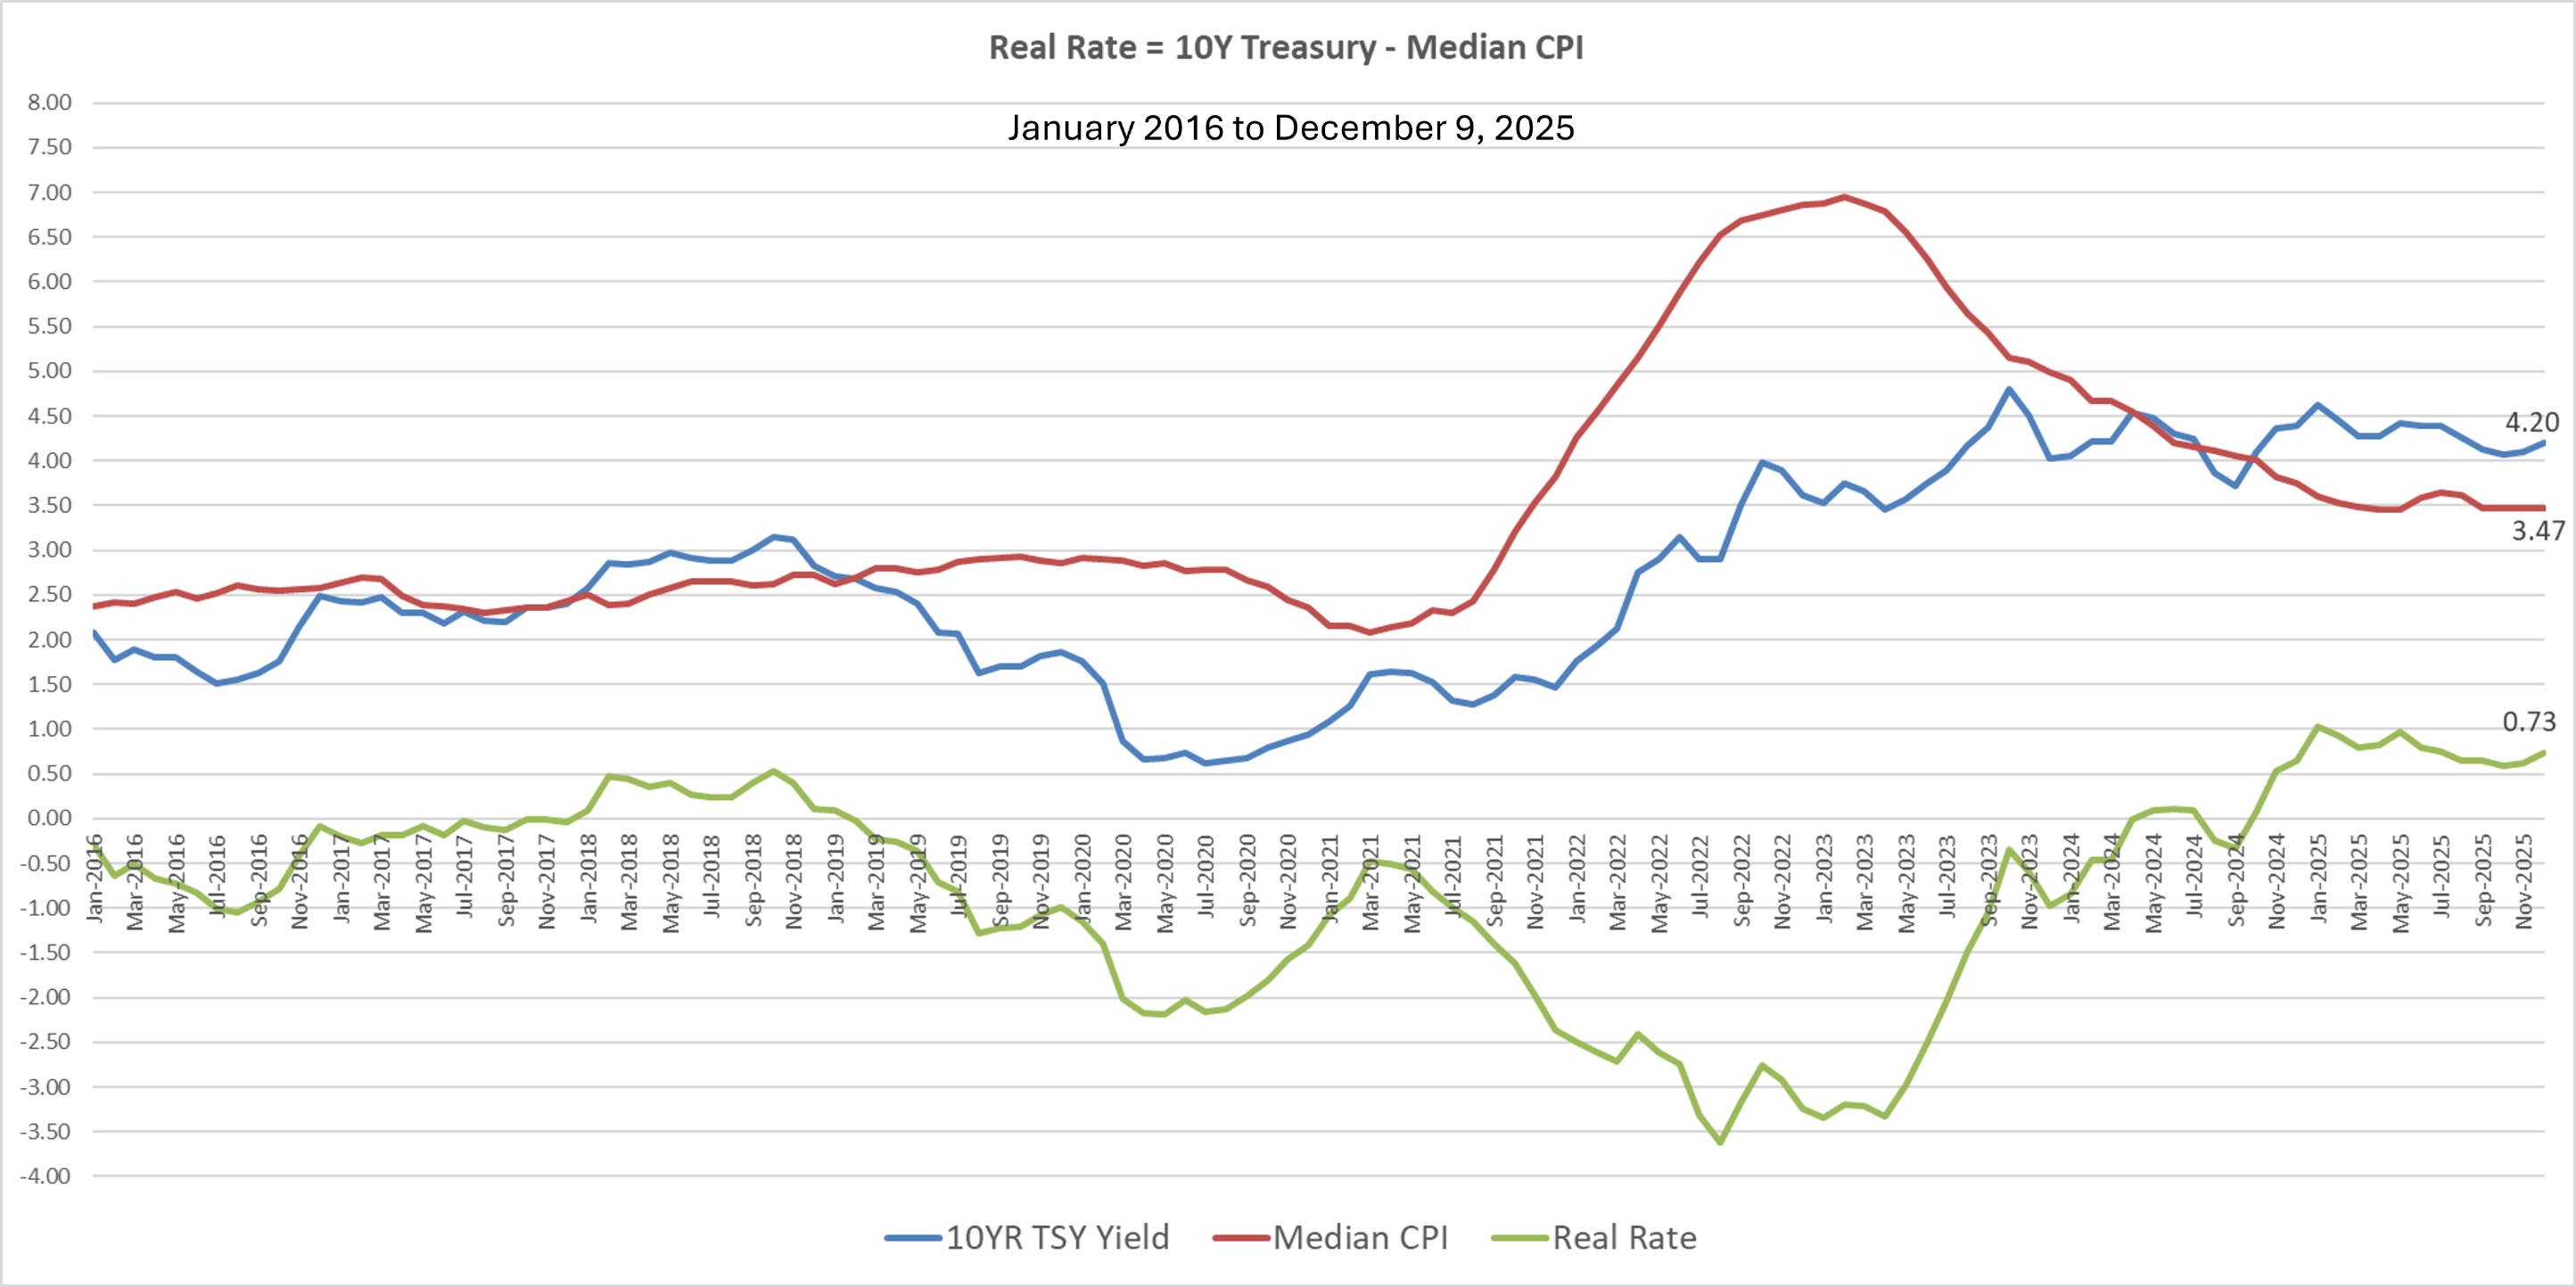
The fact that core PCE has now exceeded 3% must be worrying for the FOMC/FED that are also dealing with broader economic pressures, such as employment and US interest rates. Speaking of rates, historically the U.S. 10-year Treasury note has traded at a premium yield to inflation of roughly 2%, with periods as high as 3% or greater. The 10-year Treasury note is currently trading at a yield of 4.25% (as of 10:29 am) suggesting that a “normal” spread should have the YTM at 5.1%.

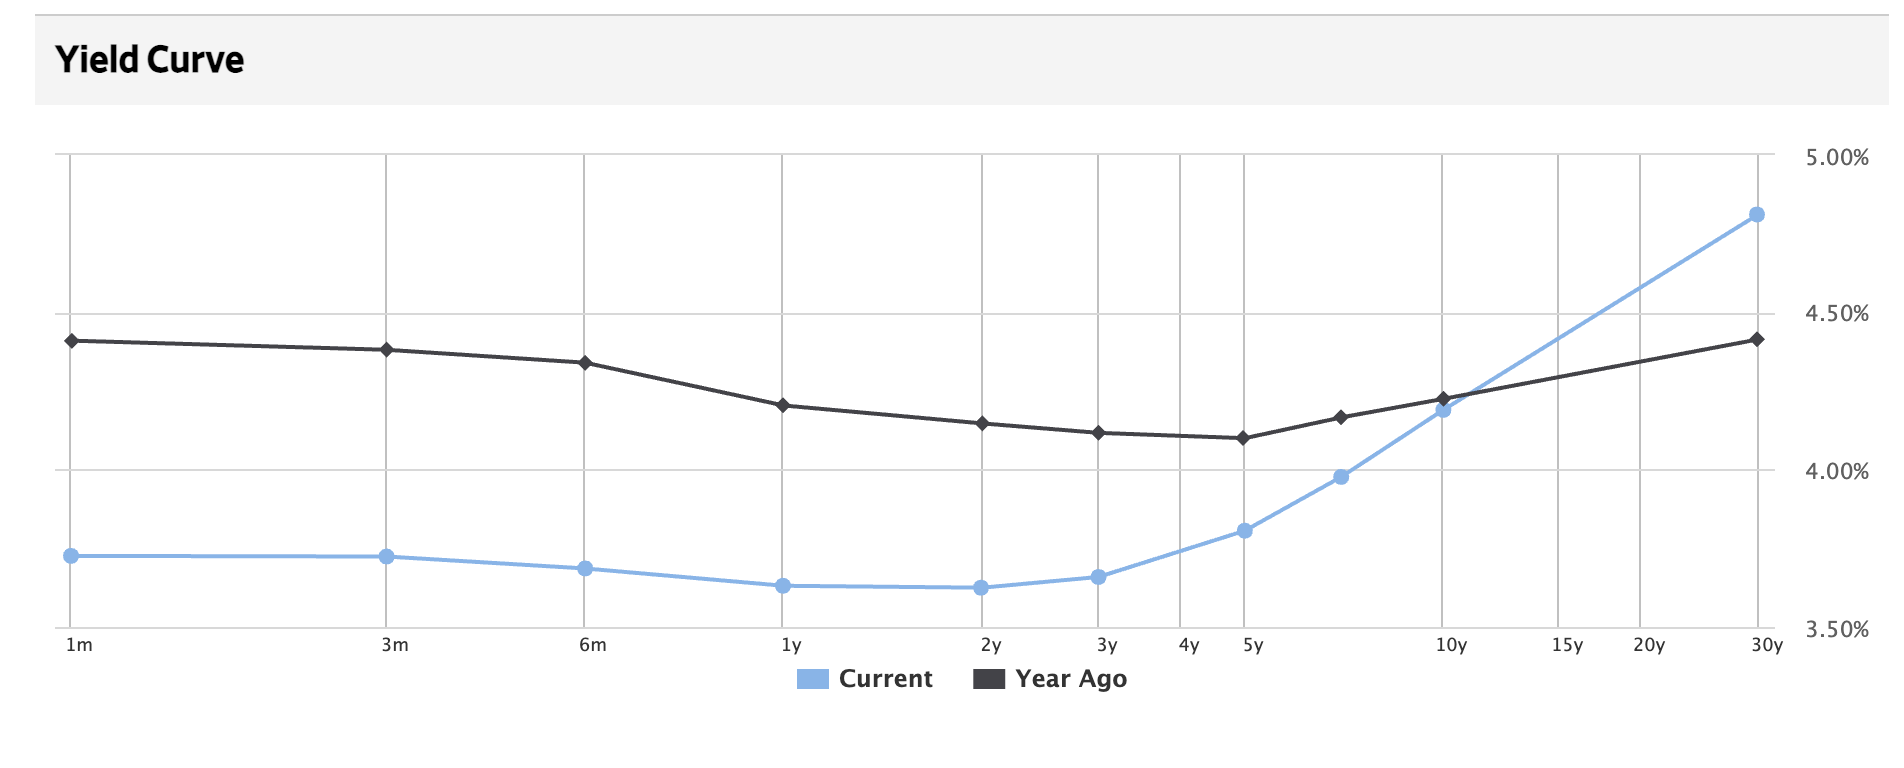
Given the great uncertainty related to current economic and geopolitical issues, it would not be surprising to see the Treasury yield curve continue to shift upwards. Such a move would create a wonderful environment for pension plan sponsors to de-risk through a cash flow matching (CFM) strategy. It is time to bring an element of certainty to the management of DB pensions to reside in a state of great uncertainty! Don’t wait to explore the amazing benefits provided by CFM.

Something Has Got to Give

By: Russ Kamp, CEO, Ryan ALM, Inc.

Not surprisingly, the U.S. Federal Reserve’s FOMC lowered rates another 25 bps today. The new target is 3.75%-4.0%, down from 4.5%-4.75% during the last 3 meetings. Currently, the 10-year Treasury yield (4.145% at 3:21 pm EST) is only marginally greater than the median CPI (Latest reading from the Cleveland Fed is 3.5% annually).

Ryan ALM, Inc.’s Head Trader, Steve DeVito put together the following comparison.

Steve is comparing the 10-year Treasury note yield (blue) versus the Median CPI (red) since January 2016. The green line is the “real” yield (10-year Treasury – the median CPI). For this period of time, there has been very little real yield, as U.S. rates were driven to historic lows before inflation spiked due to Covid-19 factors. However, historically (1962-2025), the real yield has average 2%. With rates down and inflation remaining stubbornly steady to increasing slightly, the real yield that investors are willing to take is, and has been, quite modest (0.17% since 2008). Why? Were the historically low rates in reaction to covid-19 an anomaly, or has something changed from an investor standpoint? Given today’s fundamentals, one might assume that investors are anticipating a sudden reversal in inflation, but is that a smart bet?

The WSJ produced the graph in today’s edition highlighting the change in the U.S. Treasury yield curve during the last year. As one can clearly see, the yield curve has gotten much steeper with the 30-year Treasury bond yield 0.4% above last year’s level (at 4.81%). That steepness would indicate to me that there is more risk longer term from inflation potentially rising.

So, it seems as if something has to give. If inflation remains at these levels, the yield on the 10-year Treasury note should be about 1.25% greater than today. If in fact, yields were to rise to that level, active core fixed income managers would see significant principal losses. However, cash flow matching managers and their clients would see the potential for greater cost reduction in the defeasing of pension liabilities, especially for longer-term programs. Bond math is very straight forward. The longer the maturity and the higher the yield, the greater the cost savings.

Managing a pension plan should be all about cash flows. That is asset cash flows versus liability cash flows of benefits and expenses. Higher yields reduce the future value of those promises. Remember, a CFM strategy is unique in that it brings an element of certainty (barring a default) to the management of pensions which live in a world of great uncertainty. Aren’t you ready for a sleep-well-at-night strategy?

Buy on the Rumor…

By: Russ Kamp, CEO, Ryan ALM, Inc.

After 44-years in the investment industry I’ve pretty much heard most of the sayings, including the phrase “buy on the rumor and sell on the news”. I suspect that most of you have probably heard those words uttered, too. However, it isn’t always easy to point out an example. Here is graph that might just do the trick.

There had been significant anticipation that the U.S Federal Reserve would cut the Fed Funds Rate and last week that expectation was finally realized with a 0.25% trimming. However, it appears that for some of the investment community that reduction wasn’t what they were expecting. As the graph above highlights, the green line representing Treasury yields as of this morning, have risen nicely in just the last 6 days for most maturities 3 months and out, with the exception of the 1-year note. In fact, the 10- and 30-year bonds have seen yields rise roughly 10 bps. Now, we’ve seen more significant moves on a daily basis in the last couple of years, but the timing is what has me thinking.

There are still many who believe that this cut is the first of several between now and the end of 2025. However, there is also some trepidation on the part of some in the bond world given the recent rise in inflation after a prolonged period of decline. As a reminder, the Fed does have a dual mandate focused on both employment and inflation, and although the U.S. labor force has shown signs of weakening, is that weakness creating concerns that dwarf the potential negative impact from rising prices? As stated above, there may also have been some that anticipated the Fed surprising the markets by slicing rates by 0.50% instead of the 0.25% announced.

In any case, the interest rate path is not straight and with curves one’s vision can become obstructed. What we might just see is a steepening of the Treasury yield curve with longer dated maturities maintaining current levels, if not rising, while the Fed does their thing with short-term rates. That steepening in the curve is beneficial for cash flow matching assignments that can span 10- or more years, as the longer the maturity and the higher the yield, the greater the cost reduction to defease future liabilities. Please don’t let this attractive yield environment come and go before securing some of the pension promises.