By: Russ Kamp, CEO, Ryan ALM, Inc.
We are in the midst of a project for a DB pension plan in which we were asked to model a series of liability cash flows (benefits and expenses) using cash flow matching (CFM) to defease and secure those liabilities. The plan sponsor is looking to allocate 40% of the plan’s assets initially to begin to de-risk the fund.
We first approached the assignment by looking to defease 100% of the liabilities as far into the future as that 40% allocation would cover those benefits and expenses. As it turns out, we can defease the next 11-years of projected B&E beginning 1/1/26 and carrying through to 10/31/37. As we’ve written many times in this blog and in other Ryan ALM research (ryanalm.com), we expect to reduce the cost of future liabilities by about 2% per year in this interest rate environment. Well, as it turns out, we can reduce that future cost today by 23.96% today.
Importantly, not only is the liquidity enhanced through this process and the future expenses covered for the next 11-years, we’ve now extended the investing horizon for the remaining assets (alpha assets) that can now just grow unencumbered without needing to tap them for liquidity purposes – a wonderful win/win!
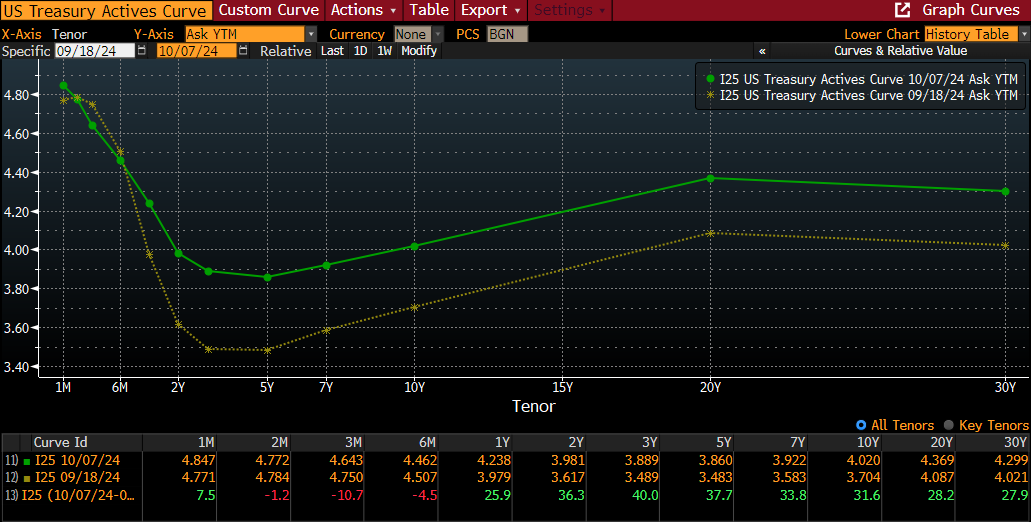
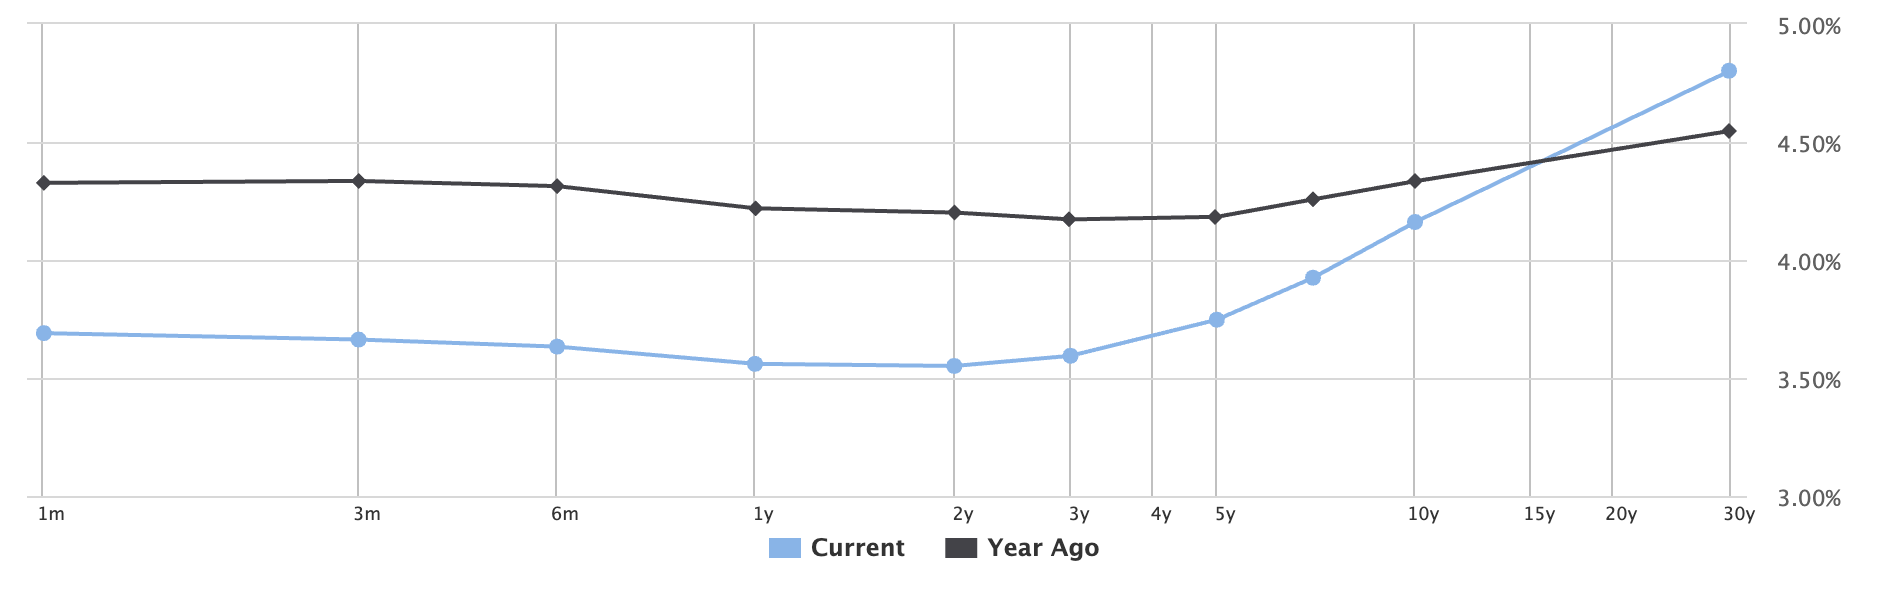
As impressive as that analysis proved to be, we know that bond math is very straightforward: the longer the maturity and the higher the yield, the greater the potential cost savings. Couple this reality with the fact that the U.S. Treasury yield curve has steepened during the last year, and you have the formula for far greater savings/cost reduction. In fact, the spread between 2-year Treasury notes and 30-year bonds has gone from 0.35% to 1.35% today. That extra yield is the gift that keeps on giving.
So, how does one use only 40% of the plan’s assets to take advantage of both bond math and the steepening yield curve when you’ve already told everyone that a full implementation CFM only covers the next 11-years? You do a vertical slice! A what? A vertical slice of the liabilities in which you use 40% of the assets to cover all of the future liabilities. No, you are not providing all of the liquidity necessary to meet monthly benefits and expenses, but you are providing good coverage while extending the defeasement out 30-years. Incredibly, by using this approach, we are able to reduce the future cost of those benefits not by an impressive 24%, but by an amazing 56.1%. In fact, we are reducing the future cost of those pension promises by a greater sum than the amount of assets used in the strategy.
Importantly, this savings or cost reduction is locked-in on day one. Yes, the day that the portfolio is built, that cost savings is created provided that we don’t experience a default. As an FYI, investment-grade corporate bonds have defaulted at a rate of 0.18% or about 2/1,000 bonds for the last 40-years according to S&P.
Can you imagine being able to reduce the cost of your future obligations by that magnitude and with more certainty than through any other strategy currently in your pension plan? What a great gift it is to yourself (sleep-well-at-night) and those plan participants for whom you are responsible. Want to see what a CFM strategy implemented by Ryan ALM can do for you? Just provide us with some basic info (call me at 201/675-8797 to find out what we need) and we’ll provide you with a free analysis. No gimmicks!