ARPA Update as of June 14, 2024

By: Russ Kamp, Managing Director, Ryan ALM, Inc.

We hope that you enjoyed a wonderful Father’s Day. I’m blessed to still have my Dad with us (95 years young). In addition, I have two sons and two sons-in-law who are wonderful fathers. It was a terrific day!

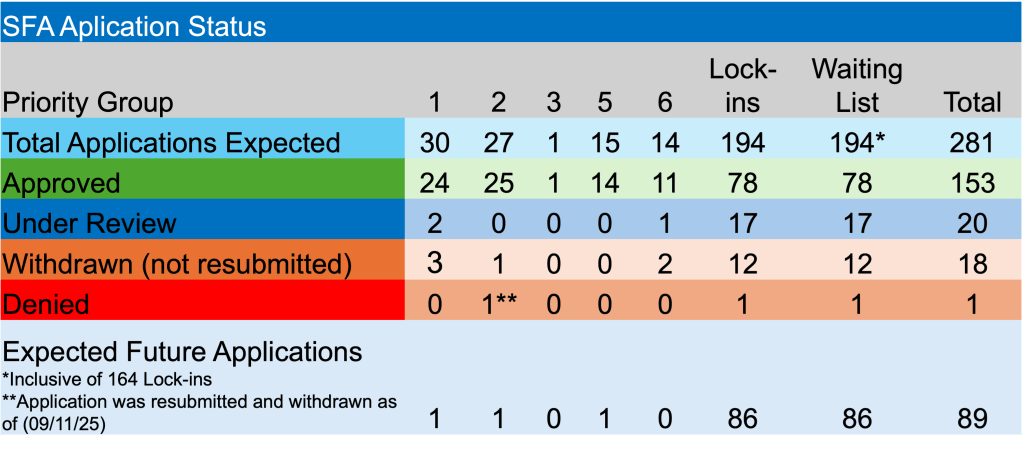
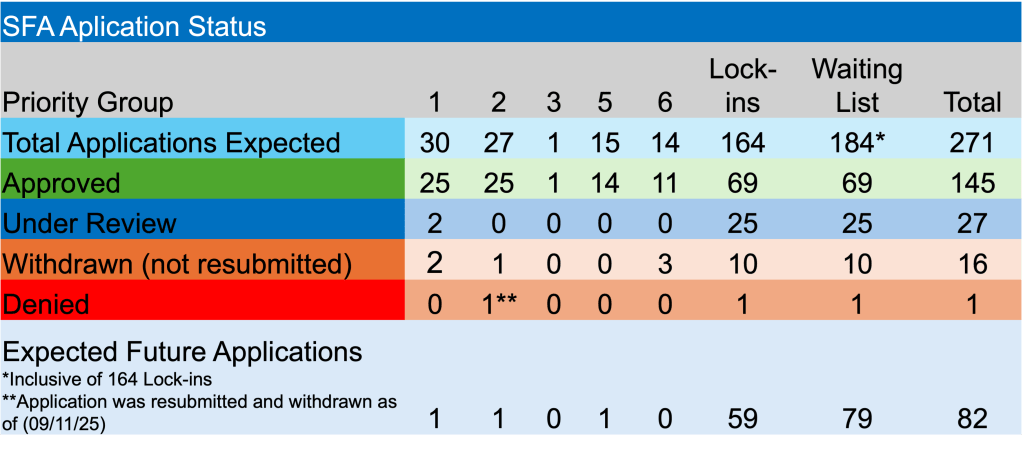
Regarding ARPA and the PBGC’s implementation of that critical pension legislation, there was some activity during the previous week. However, the filing portal remains temporarily closed for those plans still seeking relief through the SFA grants. That said, there are still 17 applications that are currently being reviewed with 6 of those nearing the 120 deadline for action. Those six plans are seeking nearly $5.5 billion in SFA. As a result, the rest of June is going to be busy for the PBGC.

The Pension Plan for the Arizona Bricklayers’ Pension Trust Fund received approval for its application. They will receive $10.7 million to protect the pensions for the 666 members of the plan. This non-priority plan received approval on their initial application. In other news, there were no applications either denied or withdrawn. However, the Graphic Communications Conference of the International Brotherhood of Teamsters National Pension Fund joined Central States as the only other plan to repay excess SFA as a result of a death audit. In this case, they are repaying just over $8 million.

Have a great week. Don’t hesitate to reach out to us if you like to learn more about cash flow matching and how it can be used to extend and protect the SFA grant assets so vital to ensuring that the pension promises are met for your participants.

Corporate Pension Funding Improves Once More – Milliman

By: Russ Kamp, Managing Director, Ryan ALM, Inc.

Milliman is reporting improvement in the funded status for the largest corporate plans. According to the Milliman 100 Pension Funding Index (PFI), corporate funding improved from 103.1% to 103.4% during May, marking the fifth consecutive monthly improvement to start 2024. Milliman attributed the improved funding to asset gains driven by the year’s best month at 2.29% driving the indexes assets up by $22 billion to $1.3 trillion. With the decline in the discount rate of 15 bps, pension liabilities grew by $18 billion and now stand at $1.25 trillion. According to Zorast Wadia, the discount rate used by Milliman is the FTSE Pension Liability Index, which is similar to ASC 715 rates. As a reminder, Ryan ALM, Inc. has produced ASC 715 rates since 2007. The $4 billion difference between pension assets and plan liabilities produced the 0.3% funding improvement.

Milliman’s monthly reporting also includes scenario testing. In the latest work, Milliman forecasts 2024 and 2025 interest rates and asset returns. In the optimistic case they forecast the discount rate at 5.88% at the end of 2024 and 6.48% at the end of 2025, while assets grow at 10.4% per annum during that time. If achieved, the funded status for the Pension Funding Index would ratchet up to 110% at the end of 2024 and 123% by 2025’s conclusion. These levels would rival what we had at the end of 1999, when Pension America should have defeased the liabilities.

A pessimistic forecast has the discount rate falling to 5.18% by the end of 2024 and 4.58% by December 31, 2025. Assets under this scenario produce only a 2.4% annualized return. If this forecast were to become reality, the PFI funded status would be 98% by the end of 2024 and 89% by the end of 2025. Since most of us have no clue where rates are going in the next couple of years, why play the game. Defease your plan’s liabilities at the current level of rates. We’ve seen too often greed creep into the equation instead of sound risk management. Use this opportunity to substantially reduce risk by matching and funding benefits and expenses with asset cash flows of interest and principal.

What A Ride!

By: Russ Kamp, Managing Director, Ryan ALM, Inc.

In 1971, Bread produced the song If. The song starts off with David Gates singing the lyrics, “if a picture paints a thousand words”. Looking at the graph below, I think that Bread and David could have used a number far greater than 1,000 to describe the impact that this picture might produce.

It never ceases to amaze me how momentum builds for an idea driving perceptions to depths or altitudes not supported by the underlying fundamentals. We see it so often in our markets whether discussing bonds, equities, or alternatives. In the case above, the “Street” became convinced that the US Federal Reserve was going to have to drive US interest rates down as our economy was about to collapse. A “please do something” cry could almost be heard from market participants who thrived on nearly four decades of Fed support. They were so accustomed to the Fed stepping in anytime that there was a wobble in the markets that it became part of the investment strategy.

It got so silly, that fixed income managers drove rates down substantially from the end of October to the end of 2023. In the process, they created an environment that was once again very “easy” and supportive of economic growth. But, that wasn’t the end of the story. I can recall a near unanimous expectation that there was going to be anywhere from 4-6 cuts in the Fed Funds Rate and perhaps more during 2024. We had analysts predicting 250 – 300 bps of rate cuts. Was the world ending?

I’ve produced more than 40 blog posts since March of 2022 that used the phrase “higher for longer” in describing an economic and inflationary environment that I felt was to robust for the Fed to reduce rates. Of course, there were many more posts in which I questioned the wisdom of the deflationary and lower rates crowd where I didn’t precisely utter those three words. Well, fortunately for pension America and the American worker, the US economy has held up in far greater fashion than predicted. The labor market remains fairly robust keeping Americans working and spending.

While inflation remains sticky and elevated, US rates have remained at decade highs providing defined benefit sponsors the opportunity to take substantial risk from the plan’s asset allocation framework through asset/liability strategies (read Cash Flow Matching) that secure the promises at substantially lower cost. As the chart above highlights, expectations for rate cuts have fallen from 4-6 or more to fewer than 2 at this point, as only a -31 bps decline is currently priced in. We’ve seen quite a repricing in 2024, and I suspect that we might need to see more, as “higher for longer” seems to be the approach being taken by the Fed.

While this is the case, plan sponsors would be wise to secure as many years of promised benefits as possible. Plan sponsors and their advisors let 2000 come and go without securing the benefits only to see two major market declines sabotage the opportunity and your plan’s funded status. Riding the asset allocation rollercoaster hasn’t worked. Is the car that you are riding in nearing the peak at this time?

Kinda Silly Question

By: Russ Kamp, Managing Director, Ryan ALM, Inc.

If you ask the average person the following questions, I suspect that most people would answer in the affirmative.

Are you handsome?

Are you intelligent?

Are you honest?

So, I found it somewhat humorous when I saw the headline from a recent conference that said, “Private Credit managers say their is more room for growth”. Are you surprised? How many investment management organizations turn down new business when it presents itself? Does it really matter that private debt has seen something like 10X asset growth in the last couple of decades? Perhaps these managers have such a unique niche that they honestly believe that their product can manage through any challenge, especially one as “trivial” as natural capacity. How many times have you heard the following: “Our maximum capacity that we previously cited was just a target amount. Now that we actually have assets under management, it is clearer that we have much more capacity than initially anticipated.” Seems convenient, doesn’t it?

I can recall a few difficult conversations with both sales and senior management when I was leading an investment team at a previous shop. Our research and portfolio management teams did an outstanding job of determining the appropriate capacity for each strategy, and we had 50+ optimizations that each represented a strategy/product. We were particularly cognizant of the capacity associated with our market neutral product, which was roughly $3 billion in AUM. We had to be most careful with shorting stocks given the borrowing rates being charged by our prime brokers. The size of trades were always a concern. Yet, it really didn’t matter to outside parties that just wanted to see assets flow into our products. It didn’t matter whether or not we would be able to generate the return/risk characteristics as previously defined by our investment team.

These awkward conversations occur all too frequently, especially for investment companies that are public and have quarterly earnings expectations that must be met. I’ve never understood how the investment management industry can claim to be “long-term” investors yet be driven by quarter-to-quarter earnings announcements that impact the investment teams when layoffs are announced. Has our industry just morphed into a number of large sales organizations? Do we have “investment” firms focused on generating appropriate return and risk characteristics? Do these firms truly understand the capacity based on trading metrics?

I don’t work for a company that participates in the Private Credit arena. I couldn’t tell you whether or not there remains adequate capacity to enable managers in that space to generate decent return and risk characteristics. But asking managers in that space whether or not they can take on more assets and generate more fees is kinda silly. I hope that the asset consulting community has the tools to evaluate capacity for not only this asset class, but any other being considered for use in a DB pension. Given that most “active” managers have failed over time to generate a return in excess of their respective benchmark, I would hazard a guess that the natural capacity for their strategy has been eclipsed. These excess assets lead to ever increasing trading costs of market impact and time delays (not commissions). Couple those costs with the fees that active managers charge and you create a hurdle that is difficult to overcome.