The Fed’s meeting notes from the September 17-18 FOMC have recently been released. Here are a few tidbits:
Some officials warned against lowering rates “too late or too little” because this risked harming the labor market.
At the same time, other officials said cutting “too soon or too much” might stall or reverse progress on inflation.
Here’s my favorite:
Officials also don’t seem in agreement over how much downward pressure the current level of the Fed’s benchmark rate was putting on demand.
I have an idea, why don’t we just have each member of the Federal Reserve’s board of governors stick their finger in the air and see which way the economic winds are blowing. It may be just as effective as what we currently seem to be getting.
Given that the economy continues to hum along with annual GDP growth of roughly 3% and “full employment” at 4.1%, I’d suggest that having a Fed Funds Rate at 5.25%-5.50% wasn’t too constraining, if constraining at all. We’ve highlighted in this blog on many occasions the fact that US rates had been historically higher for extended periods in which both the economy and markets (equities) performed exceptionally well – see the 1990’s as one example.
Furthermore, as we’ve also highlighted, there is a conflict between current fiscal and monetary policy, as the fiscal 2024 federal deficit came in at $1.8 trillion or about $400 billion greater than the anticipated deficit at the beginning of the year. That $400 billion is significant extra stimulus that leads directly to greater demand for goods and services. How likely is it that the fiscal deficit for 2025 will be any smaller?
I believe that there are many more uncertainties that could lead to higher inflation. The geopolitical risks that reside on multiple fronts seem to have been buried at this time. Any one of those conflicts – Russia/Ukraine, Israel/rest of the Middle East, and China/Taiwan – could produce inflationary pressures, even if it just results in the US increasing the federal budget deficit to support our allies.
If just sticking one’s finger in the air doesn’t help us solve our current confusion, there is always this strategy:
Milliman has released the latest results for the Milliman 100 Pension Funding Index (PFI). This index reviews the funding status each month of the top 100 U.S. corporate pension plans. The report indicated that the funded ratio declined to 102.4% at month-end from 102.6% at the end of August. Plan assets increased as a result of a 1.74% investment gain, but the discount rate declined by 0.14% to 4.96%. As a result, the growth in liabilities eclipsed asset growth leading to a $12 billion loss in funded surplus.
Assets for these combined plans now total $1.36 trillion as of September 30, while the projected benefit obligation is now $1.33 trillion giving these 100 corporate plans a $29 billion surplus. According to Zorast Wadia, author of the PFI, the current discount rate at 4.96% marks the first time since April 2023 that the rate hasn’t been >5.0%. However, so far in October we’ve witnessed a fairly significant move up in rates. If this trend continues, we could see the funded ratio for this index once again rising if the increase in rates doesn’t negatively impact the asset side of the pension equation.
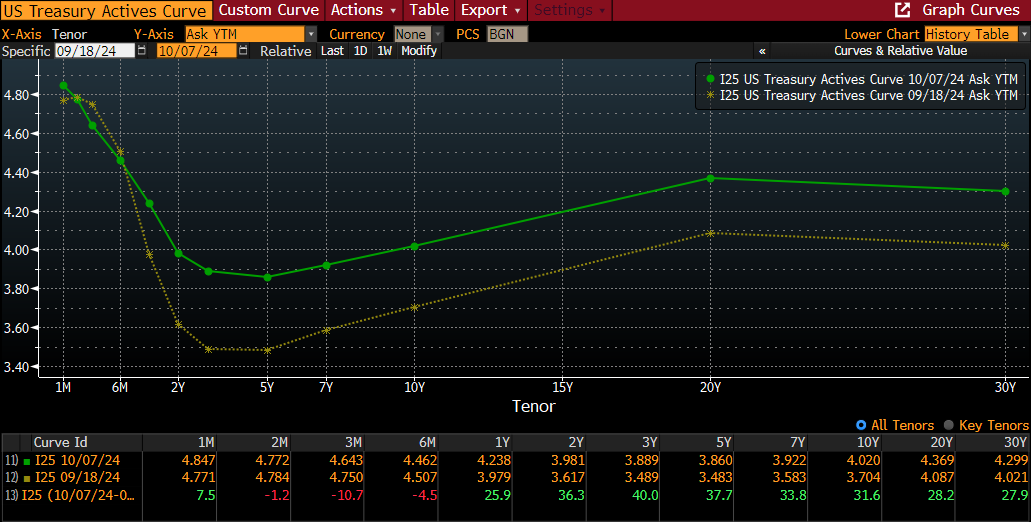
Regular readers of this blog might recall that on September 5th we produced a post titled, “Overbought?” that suggested that bond investors had gotten ahead of themselves in anticipation of the Fed’s likely next move in rates. At that time, we highlighted that rates had moved rather dramatically already without any action by the Fed. Since May 31, 2024, US Treasury yields for both 2-year and 3-year maturities had fallen by >0.9% to 9/5. By almost any measure, US rates were not high based on long-term averages or restrictive.
Sure, relative to the historically low rates during Covid, US interest rates appeared inflated, but as I’ve pointed out in previous posts, in the decade of the 1990s, the average 10-year Treasury note yield was 6.52% ranging from a peak of 8.06% at the end of 1990 to a low of 4.65% in 1998. I mention the 1990s because it also produced one of the greatest equity market environments. Given that the current yield for the US 10-year Treasury note was only 3.74% at that point, I suggested that the present environment wasn’t too constraining. In fact, I suggested that the environment was fairly loose.
Well, as we all know, the US Federal Reserve slashed the Fed Funds Rate by 0.5% on September 18th (4.75%-5.0%). Did this action lead bond investors to plow additional assets into the market driving rates further down? NO! In fact, since the Fed’s initial rate cut, Treasury yields have risen across the yield curve with the exceptions being ultra-short Treasury bills. Furthermore, the yield curve is positively sloping from 5s to 20s.
Again, managing cash flow matching portfolios means that we don’t have to be in the interest rate guessing game, but we are all students of the markets. It was out thinking in early September that markets had gotten too far ahead of the Fed given that the US economy remained on steady footing, the labor market continued to be resilient, and inflation, at least sticky inflation, remained stubbornly high relative to the Fed’s target of 2%. Nothing has changed since then except that the US labor market seems to be gaining momentum, as jobs growth is at a nearly 6-month high and the unemployment rate has retreated to 4.1%.
There will be more gyrations in the movement of US interest rates. But anyone believing that the Fed and market participants were going to drive rates back to ridiculously low levels should probably reconsider that stance at this time.
We are pleased to share with you the Ryan ALM, Inc. Q3’24 pension monitor. This quarterly report compares different liability growth rates (based on a 12-year average duration) versus the asset growth rate for public, multiemployer, and corporate funds based on the P&I asset allocation survey of the top 1,000 plans which is updated annually each November.
With regard to Q3’24, Public Pension funds (4.9%) outperformed Corporate Pension plans (3.6%) by 1.3% net of liability growth, as public pension plans had a much greater exposure to US equities (21.9%) versus Corporates (12.6%). The S&P 500 continues to produce exceptionally strong returns in this uncertain environment. From a liability standpoint, the ASC 715 discount rates (+4.6%) marginally trailed liability growth for both public and multiemployer plans that operate under GASB accounting rules using the ROA.
Please don’t hesitate to reach out to us with any questions that you might have regarding this monitor.
Welcome to October. It is always a beautiful time of year in New Jersey.
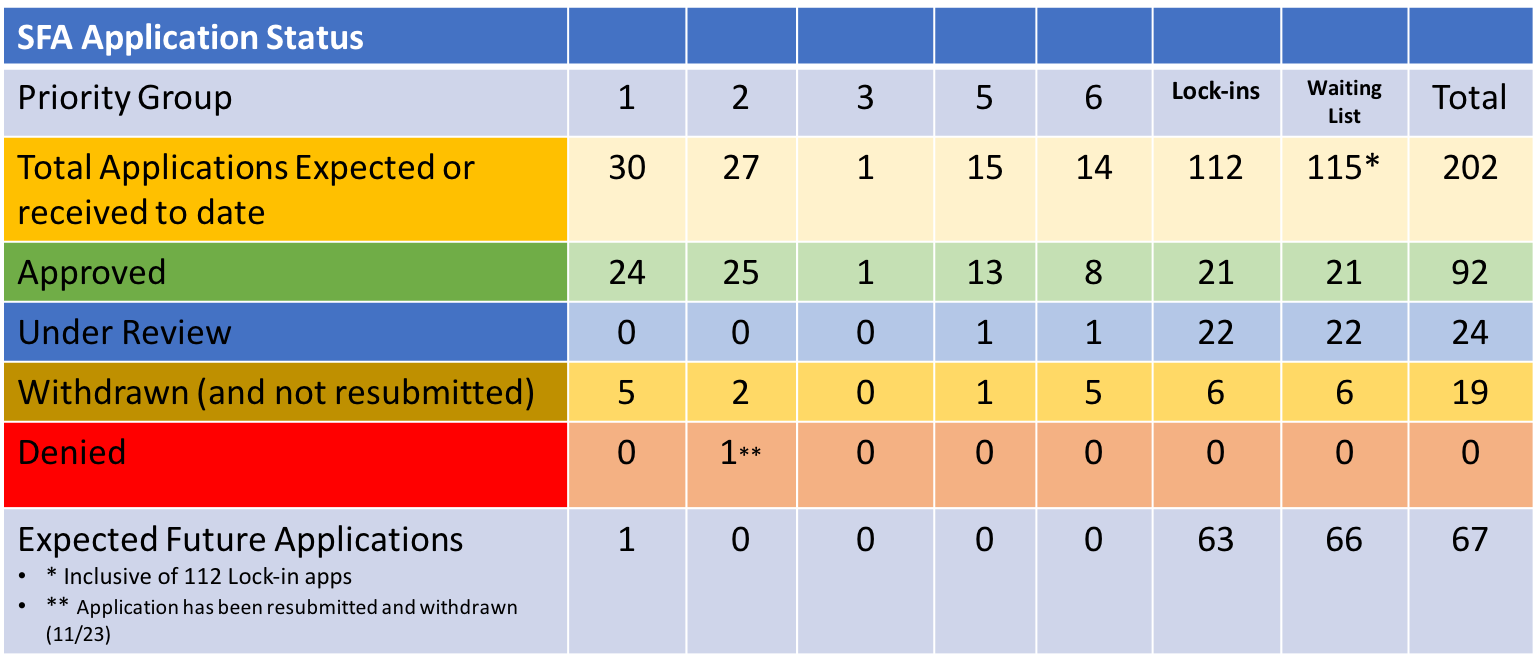
With regard to the PBGC’s implementation of the ARPA legislation, there was some activity last week. After a short pause in accepting applications, the PBGC accepted two initial applications from two non-Priority Group members. Cement Masons Local No. 524 Pension Plan and the Roofers Local No. 75 Pension Plan, both Ohio-based, filed applications seeking $11.3 million combined in SFA for 486 plan participants. As a reminder, the PBGC has 120 days to act on those applications.
In addition to the 2 new applications, the PBGC recouped another $1.2 million in SFA overpayments due to census errors. This brings the repayment to of excess SFA to $144.1 million for 19 plans. The recovery of SFA amounts to 0.37% of the grant monies awarded. In other news, there were no applications approved, denied or withdrawn during the last week. There also were no funds seeking to be added to the waitlist.
As the chart above highlights, there are 110 funds yet to have applications approved. US Treasury yields are once again on the rise after a dramatic retreat as bond investors plowed into bonds anticipating very aggressive rate cuts by the Federal Reserve. Higher rates reduce the PV cost of those FV payments of benefits and expenses. A defeasement strategy significantly reduces interest rate risk as FVs are not interest sensitive. As we’ve discussed on many occasions, using a cash flow matching strategy to meet those benefits and expenses reduces the uncertainty associated with a traditional benchmark relative fixed income product. We are happy to discuss this subject in far greater detail.
How comforting would it be for both plan sponsors and their advisors to know how a particular strategy is going to perform over some defined period of time? I would think that having that knowledge would be quite comforting, at least as a “core” holding. Do you think that a core fixed income manager running a relative return strategy versus the Bloomberg Barclays Aggregate Index could tell you how that portfolio will perform in the next 10 1/2 years? No. Ryan ALM can with a very high degree of certainty. How’s that? Well, cash flow matching (CFM) of asset cash flows to liability cash flows locks in that relationship on the day that the portfolio is constructed. Ryan ALM views risk as the uncertainty of achieving the objective. If the true pension objective is to fund benefits and expenses in a cost-efficient manner with prudent risk, then our CFM model will be the lowest risk portfolio.
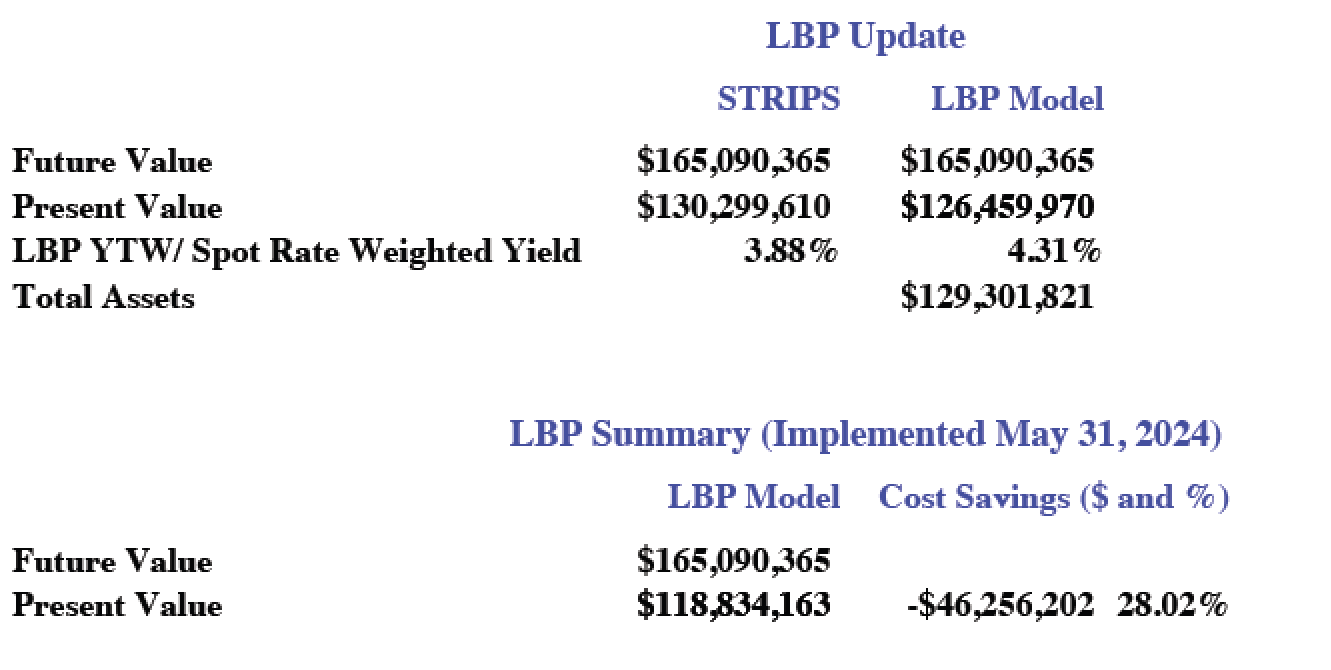
We were awarded a CFM assignment earlier this year. Our task was/is to defease the future grant payments for this foundation. On the day the portfolio was built, we were able to defease $165.1 million in FV grant payments for only $118.8 million, locking in savings (difference between FV and PV of the liability cash flows) of $46.3 million equal to 28.0% of those future grant payments. That’s fairly substantial. The YTM on that day was 5.19% and the duration was 5.92 years.
Earlier this week, we provided an update for the client through our monthly reporting. The current Liability Beta Portfolio (the name that we’ve given to our CFM optimization process) has the same FV of grant payments. On a market value basis, the portfolio is now worth $129 million, and the PV of those future grant payments is $126 million. But despite the change in market value due to falling interest rates, the cost savings are still -$46.3 million. The YTM has fallen to 4.31%, but that doesn’t change the initial relationship of asset cash flows to liability cash flows. That is the beauty of CFM.
Now, let me ask you, do you think that a core fixed income manager running a relative return portfolio can lay claim to the same facts? Absolutely, not! They may have benefitted in the most recent short run due to falling interest rates, but that would clearly depend on multiple decisions/factors, including the duration of the portfolio, changes in credit spreads, the shape of the yield curve, the allocation among corporates, Treasuries, agencies, and other bonds, etc. Let’s not discount the direction of future interest rate movements and the impact those changes may have on a bond strategy. In reality, the core fixed income manager has no idea how that portfolio will perform between now and March 31, 2035.
Furthermore, will they provide the necessary liquidity to meet those grant payments or benefits and expenses, if it were a DB pension? Not likely. With a yield to maturity of 4.31% and a market value of assets of $129.3 million, they will produce income of roughly $5.57 million/year. The first year’s grant payments are forecast to be $9.7 million. Our portfolio is designed to meet every $ of that grant payment. The relative return manager will be forced to liquidate a portion of their portfolio in order to meet all of the payments. What if rates have risen at that point. Forcing liquidity in that environment will result in locking in a loss. That’s not comforting.
CFM portfolios provide the client with the certainty of cash flows when they are needed. There is no forced selling, unlike the relative return manager that might be forced to sell in a market that isn’t conducive to trading. Furthermore, a CFM mandate locks in the cost savings on day 1. The assets not used to meet those FV payments, can now be managed more aggressively since they benefit from more time and aren’t going to be used to meet liability cash flows.
Asset allocation strategies should be adapted from a single basket approach to one that uses two baskets – liquidity and growth. The liquidity bucket will house a defeased bond portfolio to meet all the cash flow requirements and the remainder of the assets will migrate into the growth bucket where they can now grow unencumbered. You’ll know on day 1 how the CFM portfolio is going to perform. Now all you have to worry about are those growth assets, but you’ll have plenty of time to deal with any challenges presented.
We are pleased to share with you Ryan ALM Inc.’s 3Q’24 Newsletter. As you will read, the third quarter saw asset values continue to grow, while liabilities also increased due to falling US interest rates. However, asset growth has far exceeded liability growth in 2024 leading to improved funded ratios for all DB plan types. In addition, the current level of US rates is supportive of derisking strategies. Given elevated valuations, it makes sense to reduce risk before the markets impact the improved funded status.
As always, we encourage you to reach out to us with your questions. We want to be your source for anything liability-related. Please don’t hesitate.
I recently participated in a new program put on by the Florida Public Pension Trustees Association (FPPTA). They’ve introduced a higher-level program for trustees that really want to dive more deeply into pension issues. I’m thankful to have the opportunity to participate both as a speaker and a coach. At the inaugural event, the FPPTA leadership invited Von M. Hughes, the author of the book, U.S. Public Pension handbook”, which he described as a comprehensive guide for trustees and investment staff. During the Q&A session, Von was asked what differentiates a good fund from one that is performing poorly. His response was simple and direct. The pension systems that are best in class make the annual required contributions (ARC).
His response didn’t suggest anything about plans with internal staff versus those that outsource all investment functions. It had nothing to do with how complex the overall asset allocation was or the percentage allocated to alternatives. Furthermore, it didn’t matter about the size of the fund. It was simply, are you funding to a level required each and every year. Brilliant!
We all know which public funds are struggling and which are near full funding. There are enough entities reporting on the key metrics annual, if not more frequently. A closer look at these funds does support Von’s claim. But it isn’t just the lack of discipline in providing the necessary funding to secure the promises that have been met. There are also issues with regard to actuarial practices and legislative constraints. There is an interesting article in P&I with Brian Grinnell, former Chief Actuary, for the Ohio State Teachers’ Retirement System. Grinnell left the pension fund in May after more than 10 years, as the Chief actuary. According to Grinnell, he left the system because he “was not comfortable with the direction the plan was headed, and I didn’t feel like my continued participation would be positive.”
Grinnell discussed several issue, but the two that jumped out at me were the open amortization period and fixed contributions. In the case of the open amortization, Grinnell mentioned that “the amortization period for the retirement system’s unfunded pension liabilities under the STRS defined benefit plan had become infinite — meaning that it would never become fully funded.” Can you imagine having a mortgage with such a feature? With respect to the fixed-rate structure of both contributions and benefits, Grinnell mentioned that following a poor performance year the normal practice would be to increase contributions, which in the case of the Ohio plans is not possible without legislative action.
If creating a strong public pension system is predicated on the entity’s ability to meet the ARC, why would our industry agree to accounting and actuarial practices that restrict prudent action? Amortization periods should be fixed and contributions should be a function of how the plan is performing. As we’ve stated many times, DB pension plans are too critically important to millions of American workers. Investing is not easy. Forecasting the longevity of the participants is not easy. Let’s at least get the easy stuff right! Fund what is required!
October isn’t just for leaf peepers, although it is a special time of year for those of us living in the Northeast. Importantly, October is also National Retirement Security Month. For those of you who regularly follow this blog, you know that we (at Ryan ALM, Inc.) are huge supporters of DB pension plans. Fortunately, we aren’t the only ones. In a wonderful post published by the National Public Pension Coalition, Ariel McConnell writes about the importance of supporting public pension plans, as well as those sponsored by private organizations.
Ms. McConnell highlights many concerns regarding the current state of retirement readiness among American workers. Frighteningly, she points out that 57% of Americans don’t have any retirement savings, and those with 401(k)s have a median balance of only $27,376. That will barely provide you with the financial resources to get you through one year let alone a retirement that could stretch well beyond 20 years. She also highlights how each of us can become more active in the fight to get every American ready for their retirement. We want each worker to have the chance to enjoy their “golden years”. Let’s not let poor policy decisions tarnish that dream.
Please join Ariel, the National Public Pension Coalition, Ryan ALM, Inc., and many more organizations in the fight to protect and preserve defined benefit plans for all. I can only begin to guess at the significant economic and social consequences if our Senior population is forced to live on a median balance as insignificant as the one mentioned in NPPC’s blog post.
We are pleased to share with you the second installment in the Ryan ALM, Inc. Pension Myth series. How many we produce has yet to be determined, but we can tell you that there are enough myths to keep us busy for a while. This one is focused on the critical role that contributions play. Given that benefits and expenses are paid net of contributions, we believe that future contributions are an asset of the fund and should be included in the pension plan’s Funded Ratio.
We hope that you find our thoughts useful as they challenge the industry’s “common wisdom”. We’d welcome the opportunity to discuss these concepts with you. Please don’t hesitate to reach out.