The Risk/Reward of Bonds

Unlike any other asset class, fixed income (bonds) have two risk/reward values:

  1. Total Return
  2. Certain Cash Flows

Total Return Value

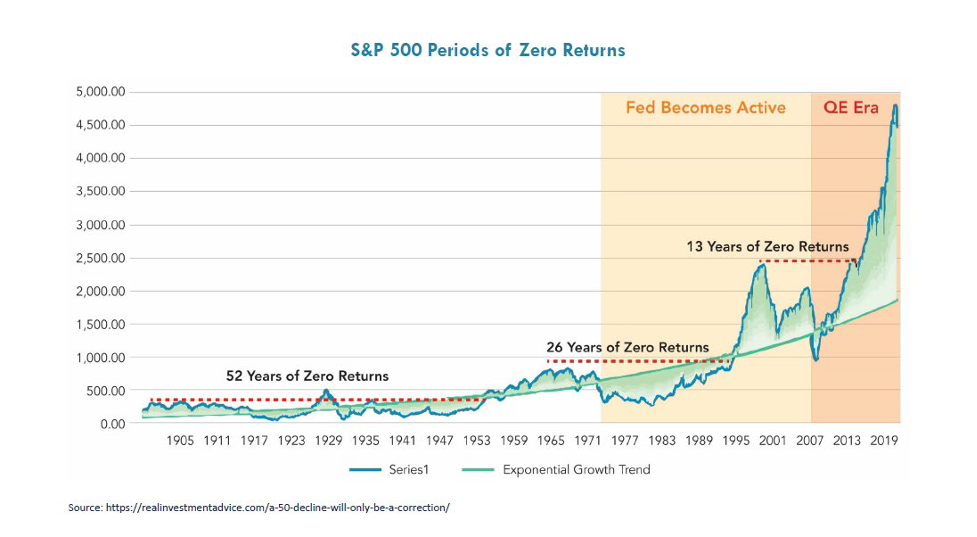
The total return value in bonds is the converse of interest rate movements. When rates go down, as they have from 1981 to 2021, they produce price appreciation and higher total returns. And the opposite happens when rates go up as they did from 1953 to 1981.

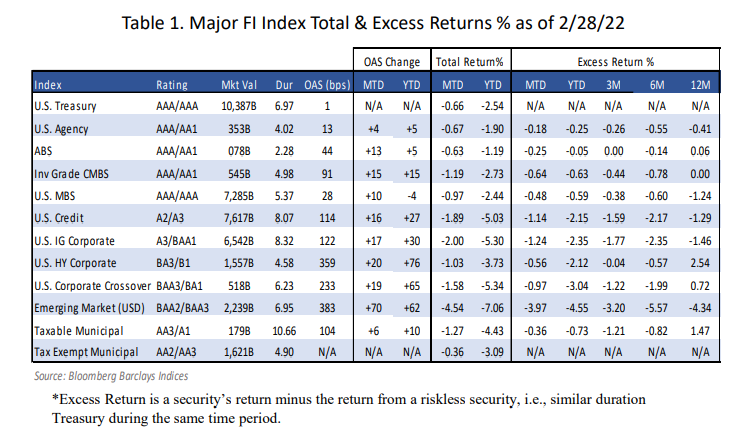
Since the start of 2022, interest rates have trended upward causing negative bond returns (BB Aggregate Index -3.25% YTD thru 02/28/22 ). Given the current inflation rate of over 7.0% on the CPI and over 9.0% for the PPI, coupled with the expectation that the Fed will raise short rates several times this year… this interest rate trend to higher rates should continue. As a result, pensions should expect negative fixed income returns this year and for the foreseeable future.

Certain Cash Flow Value

If you buy bonds for their intrinsic value (certainty of cash flows) you will immunize or mitigate interest rate risk! Since cash floware future values they are not affected by interest rate movements. Moreover, any excess cash flow reinvested will be able to buy new cash flows at reduced costs. This is truly the value in bonds and we strongly recommend that pensions use bonds as their liquidity or Beta assets. Let the performance or Alpha assets be the non-bond assets. Use bonds to cash flow match pension benefits and expenses chronologically. This synergy of Beta and Alpha assets should secure benefits, reduce funding costs, and buy time for the Alpha assets to grow unencumbered.

Cash flow matching by any name (defeasance, dedication, immunization) may be the oldest fixed-income strategy. It should be the core portfolio of a pension and the fixed income strategy chosen by pensions today given the likelihood of higher interest rates. With stocks also struggling this year (S&P 500 -10.7% YTD thru 03/07/22), a cash flow matching bond allocation will buy time for the equity allocation to recover without any dilution to fund benefits and expenses. It isn’t too late to change your fixed income approach, as we are only in the 1st inning of what could be a full 9-inning game!

A massive shift to Risk Assets – Are DB Plans Better Off?

This post was originally produced on 10/15/21.

“Increasing equity exposure in the hope that a greater return will reduce the need for future contributions hasn’t yet proven to be true. It has ensured that total expenses (management fees) have gone up, as well as the overall volatility of the funded status, but success hasn’t been guaranteed. Given where valuations currently reside, either dramatically reduce the equity exposure or reconfigure your fixed-income exposure from a total return-seeking mandate to a cash flow matching implementation that now allows time for the alpha assets to recover after the next equity market correction. There will be one!”

Roughly 80%

We are monitoring closely the application filings for Special Financial Assistance (SFA) under ARPA which began with Group 1 eligible plans in July 2021. Group 1 plans were those pension funds that were already insolvent or those that were forecast to become insolvent before March 2022. To date, 18 Group 1 plans have filed an application. I reached out to the PBGC to see if all the eligible plans in that Group had been filed and they let me know that they don’t have a complete list of all eligible plans and they only know in what Priority Group a pension system is once the application has been processed. However, my contact did estimate that roughly 80% of the Group 1 eligible plans have filed an application with the PBGC.

As a reminder, the ARPA legislation states:

APPLICATION DEADLINE.—Any application by a plan for special financial assistance under this section shall be submitted to the corporation (and, in the case of a plan to which section 432(k)(1)(D) of the Internal Revenue Code of 1986 applies, to the Secretary of the Treasury) no later than December 31, 2025, and any revised application for special financial assistance shall be submitted no later than December 31, 2026.

There is no penalty for filing an application after the next Priority Group begins but as the language specifies, new applications must be submitted by December 31, 2025. I’m sure that these plans have their reasons for not yet processing an application, but personally, I’d want to get the SFA as soon as possible and have it begin working for my plan and participants. More to come!

Big Swing…And a Miss!

I suspect that those who read this blog regularly are likely able to finish this next point before they get to the end of the sentence. But it is worth repeating. The primary objective in managing a DB pension plan is to SECURE the promised benefits (liabilities) in a cost-efficient manner and with prudent risk. If everyone had focused on that objective 4 decades ago, instead of a return objective, we wouldn’t have a pension funding crisis today. Pension plans could have secured the promises with very little risk back in the early 1980s. In fact, investing solely in the Lehman Aggregate Index (now Bloomberg Barclays), one would have achieved a 40-year annualized return of 7.69%, easily beating most ROA objectives, with only a 4.65% standard deviation. Yes, you read that right – only a 4.65% SD over 40-years, which equates to a Sharp Ratio of 0.77.

One didn’t have to get fancy by adding a plethora of products/asset classes, reducing liquidity to meet benefits in the process, while enduring ever-growing contribution expenses. No, a simple strategy to invest 100% in fixed income would have solved all of your funding issues. All of them! Regrettably, we outthought ourselves and as a result, we are paying the piper today. Major cities are struggling under the weight of the contributions that they must make, as they take up more and more of the annual budgets. Corporate America has basically abandoned private pension plans. None of this had to happen if we had just remembered that the pension objective is to secure benefits.

We missed the opportunity in the early ’80s and again in 1999 when most pension plans were fully funded. We equated the yield of a bond with its return, which is not correct. As bond yields declined asset allocation “strategies” minimized the use of fixed income believing that bonds would be an anchor on returns. As a result, we subjected our plan’s asset bases to huge volatility, perhaps 3-4 times the volatility of the Aggregate index. As I wrote the other day, the main consequence of riding the asset allocation rollercoaster is the tremendous growth in contributions, which you can’t recoup.

At the end of 2021, we were imploring pension America to take risks off the table. Funded ratios had been improved and markets performed well above long-term expectations. Did anyone listen? Unfortunately, equity and fixed income markets have performed poorly to start the year. Funded ratios and funded status are under pressure. Inflation, the possibility of rising rates, and war in Europe are creating potentially huge headwinds for our pension systems. The good news: it isn’t too late to do something about it.

As we’ve discussed, traditional total return fixed income programs will be under stress in a rising rate environment. The 39-year bull market in bonds may have expired. It doesn’t take much of an interest rate move upward to generate some pretty ugly performance. The following chart from RW Baird highlights the impact in just the first two months of 2022 on a variety of fixed-income instruments.

Solution: Don’t use the fixed income assets for returns. Use bonds for their cash flows, as they are the only asset class with a known cash flow schedule of interest and principal payments (ie future values). One can construct a carefully matched portfolio of asset cash flows to liability cash flows to secure those promised benefits at both a reasonable cost and with prudent risk! Sound familiar? Defined benefit plans need to be protected and preserved as they are the only true retirement account. However, burgeoning contribution expenses are jeopardizing the future of these important vehicles. Let’s get back to pension basics. Treat your pension system as if it were a lottery system or insurance company. Understand what that future promise looks like and manage to it. Don’t let a return-focused asset allocation strategy guarantee more volatility with no assurance of success.

We Applaud Michigan’s Effort to Pass House Bill 5054

Many US states find themselves with surplus funds after significant support from ARPA legislation. Although direct DB pension plan support was not a permitted use of the ARPA proceeds, states with surpluses are looking for ways to prop up their underfunded systems. One state, Michigan is considering making available to its municipalities $1.15 billion in state grants to help pay down the unfunded pension liabilities.

“House Bill 5054 would make $900 million in grants available to municipalities with pension plans less than 60% funded and $250 million for those that are at or above the 60% mark if the governmental units agree to a series of conditions (my emphasis).” source: (The Bond Buyer)

The proposed legislation would also direct another $350 million to the state police retirement system. Local government groups are said to be in favor of this proposal as the state contemplates the allocation of $7 billion in surplus revenues.

Importantly, these grants would come with conditions that I believe are quite appropriate for plans that are as poorly funded as those that would be eligible to receive the payments. Pension systems that are <60% funded must make all actuarially determined contributions and hold the discount rate and the assumed rate of return (ROA) at current levels or lower. Furthermore, they must adopt the most recent mortality tables recommended by the Society of Actuaries and they must not enhance benefit payments for 10 years after accepting the grant or the local unit must repay the full value of the grant.

Future benefit increases can only be adopted if the system is 80% funded and the value of the new benefit is 100% funded. We, at Ryan ALM, are huge supporters of DB pension systems, but we believe that the current pension promise should absolutely be secured before benefits are enhanced. It makes little sense to us that pension systems jeopardize the plan’s overall funding in an attempt to elevate current payouts. The legislation limits Grants to a maximum of $100 million per system.

It is great to see legislators utilizing excess funds to sure up their pension systems. Poorly funded plans are hard-pressed to close the funding gaps through investment returns only. Remember that a 50% funded plan must beat the ROA by twice in order to maintain the funded status. Yes, a plan that is 50% funded and has a 7.5% ROA objective must generate at least a 14.5% annual return, or the funding gap grows in $ terms. How likely are we to see above-average returns from the capital markets given the extraordinary returns achieved in the markets since the Great Financial Crisis (GFC)? When investments fail to achieve the objective plans must contribute more. House Bill 5054, if passed, shows that the legislators are not waiting to see if Michigan plans fall short of their objectives. Good for them!

An ARPA Update

I hope that you had a great weekend. I can’t believe that February has already come and gone (effective today). Here’s the weekly update related to ARPA application filings, approvals, and payments. This is going to be a fairly simple update, as we haven’t had a new application filed since February 7th (Mid-Jersey Trucking Industry and Teamsters Local 701 Pension and Annuity Fund). We have had five applications approved (four of them with their initial filing) and each of those five Group 1 Priority plans have been paid their SFA as of February 18th. Here is a list of those plans:

Local 138 Pension Trust Fund
Idaho Signatory Employers-Laborers Pension Plan
Bricklayers and Allied Craftworkers Local 5 New York Retirement Fund Pension Plan
Road Carriers Local 707 Pension Plan
Local 408 International Brotherhood of Teamsters, Chauffeurs, Warehousemen and Helpers of America Pension Plan

The total dispersed so far is $1.1 billion, which continues to be a small drop in the bucket given that the estimated cost of the legislation is roughly $95 billion. Furthermore, the pace of filings among Group 2 Priority funds continues to be quite slow with only 7 plans having filed since becoming eligible in late December 2021. Within Group 2 we have 4 MPRA Suspension and Partition plans that have been filed and 3 identified as Critical and Declining.

Lastly, we have yet to get the Final, Final Rules from the PBGC on how this legislation should be implemented. Any talk/action related to expanding the list of eligible investments beyond the current investment-grade bonds limitation is inappropriate for the funding objective, especially when one notes the incredible volatility in markets to begin this year. If the legislation truly desires the ensuring of benefits (and expenses) for as long out as possible, allowing more volatile investments in the SFA bucket is a risky contradiction! Use the legacy assets to enhance returns but keep the SFA assets matched against liability cash flows to maximize the security of benefit payments. As it is, the goal of securing the promised benefits for 30 years is a pipe dream. Don’t shorten or endanger what is already a modest period of time.

This is the Impact of Riding the Asset Allocation Rollercoaster

I am happy to report that today’s post is the 1,000 produced on this blog. I’ve tried to cover many different aspects of pension management. My blogs are intended to help, encourage, urge, foster, persuade, promote, advance, and even implore change in how Pension America approaches the critically important task of protecting and preserving defined benefit pensions for the masses. Have I been successful? You tell me, but I’m not prepared to stop! There is much more work ahead of us.

For those of you who have followed this blog for some time, you will remember that I’ve used a rollercoaster to symbolize pension asset allocation. We tend to ride markets up and markets down with little regard for the long-term impact of how these moves actually impact the pension systems. I’m frequently told that markets always recover, and the last 12+ years are used as an example. Yes, markets recovered substantially from the depths of the two extraordinary corrections witnessed during the ’00s. But, often hidden from view is the impact that those significant drawdowns had on pension contributions. That growth has been mindboggling. Remember that any increase in contribution costs is NOT repaid when pension plans recover.

You might ask: How have contributions grown in an environment in which returns have been so spectacular? It is a fair question. Let’s review the pension funding formula: B+E = C+I where B+E are benefits and expenses, while C+I are contributions and investment earnings. Most pension systems were fully funded after 1999 and contribution expenses were modest and controlled. However, during the two major corrections of the ’00s, contributions (C) had to make up for the devastating impact of a very negative period for investment earnings (I). I present the following information as a representation of the brutality of this period on pension contributions. The data highlighted is for a large public fund plan in a major metropolitan area. This history is from their latest actuarial report.

Statutory
Fiscal YearsFunded RatioContribution paid% of Payroll
6/30/00146% $               68,619,745.000.90%
6/30/01143% $             100,024,692.001.30%
6/30/02135% $             105,660,069.001.20%
6/30/03124% $             107,992,496.001.20%
6/30/04114% $             310,589,074.003.50%
6/30/05109% $             822,763,025.008.90%
6/30/06101% $          1,024,358,175.0011.10%
6/30/0797% $          1,471,029,609.0015.50%
6/30/0897% $          1,874,242,487.0019.00%
6/30/0996% $          2,150,438,042.0020.60%
6/30/1075% $          2,197,717,073.0020.00%
6/30/1176% $          2,387,215,772.0020.80%
6/30/1276% $          3,017,004,318.0025.50%
6/30/1368% $          3,046,845,264.0025.50%
6/30/1468% $          3,114,068,148.0025.60%
6/30/1570% $          3,160,257,868.0025.60%
6/30/1671% $          3,365,454,212.0027.30%
6/30/1772% $          3,328,192,582.0026.50%
6/30/1876% $          3,377,024,173.0026.30%
6/30/1968% $          3,694,364,590.0026.70%
6/30/2074% $          3,726,701,492.0026.30%

Despite wonderful markets, contribution expenses for this fund have increased by 54.8 TIMES!! Not 54.8%. These additional contributions were required due to the I in the equation above producing significant negative experiences. When that occurs, the C has to make up the shortfall. The important fact is that these enhanced contributions are never returned to the employer. Instead of taking risks off the table and winning the game when this plan was dramatically overfunded on 06/30/00, they let the assets ride! The result has been devastating. If you think that this plan’s experience is unique, please think again. Most public pension systems were overfunded in 1999. A significant majority (most) are not today, and their contribution expenses have skyrocketed.

As we neared the end of 2021, we once again witnessed improved funding that was being hailed throughout our industry, but instead of doing anything to protect that improved funding, we elected to let the “good times roll”. How has that worked out since the beginning of 2022? Will this period of market destabilization once again lead to significant growth in contributions? For how much longer will these plans be able to convince their taxpayers (providers of C) that these plans should continue to be supported? Isn’t it time for a rethink?

The Importance of Dividends on the Total Return

Everyone in the Pension arena understands the actuarial formula: B+E = C+I, where outflows (benefits and expenses) equal inflows (contributions and investment earnings). This equation strives for harmony, but as we’ve witnessed through many decades, the uncertainty around I places a greater and greater emphasis on C.

When pension systems were first introduced, it was not uncommon, in fact, it was very common, that pension plans were managed in a similar fashion as lottery systems and insurance companies where liabilities (pension promises) were measured, monitored, and MANAGED. Unfortunately, we are in an environment where securing the promised benefits is passe and the focus has become an arms race trying to create the highest return. In periods of dislocation in the markets sponsoring entities are forced to contribute more and more placing a greater burden on those companies, municipalities, and states to make up for the shortfall. Does this make sense?

I just presented at the FPPTA with two members of a top consulting team. They presented data from Horizon Actuarial that had aggregated data from 39 entities forecasting future returns, risk, and correlation. Given how strong the last 12+ years have been for the markets, it isn’t surprising that the forward view is for below-average returns for the next decade (regression to the mean is a real thing). They used one of their client’s asset allocations and the Horizon forecasts to come up with a 5.3% expected return for this “model” portfolio for the next 10-years. This forecasted return also comes with a +/- 11+% standard deviation.

Wouldn’t it be great if the expected return for equities came with less uncertainty, but in an environment in which the dividend yield for the S&P 500 is only 1.29% (as of 12/31/21), most of the total return needs to come from price appreciation. This hasn’t always been the case. In fact, it was not unusual for the dividend yield on the S&P 500 to be in excess of 5% annually (the average yield has been 4.3% throughout time), with a peak yield being achieved in 1932 at 13.84%. Wow! Can you imagine starting the year with that type of return? You wouldn’t need for stocks to generate any price appreciation/return to meet your return on asset assumptions (ROA). The chart below highlights the importance of dividends on the S&P 500’s total return since 1940.

Why have we as investors in the US equity market accepted this recent development. Why are we assuming most, if not all, of the risk for being an equity investor? Shouldn’t we be demanding that corporate America provide more robust dividends? Sure, there have been changes in tax policy industry/sector exposures that might have led to some of the deemphasis of dividends, but it certainly doesn’t account for all. The current yield is only slightly higher than the lowest level achieved in 2020 (1.11%). The dividend yield used to be a value measure for the index with levels below 4% signifying over valuation. What does the 1.3% seen today portend?

As the chart above highlights, it is critically important that we allow dividends to be reinvested back into the S&P 500, as it drives roughly 60% of the total return over 20-year moving averages and 48% over 10-year moving averages. But, is that what we do within our pension systems? Not really. Plan sponsors are in search of liquidity every month to meet benefits and expenses. They often sweep all available cash from each of their managers irrespective of the growth potential for reinvestment. Given this practice, we would highly recommend that asset allocation strategies bifurcate the assets between liquidity and alpha buckets. The liquidity bucket should use the cash flows from bonds to meet all the current funding needs (liability cash flows), while the alpha bucket can now grow unencumbered as those assets are no longer a source of liquidity.

If the Horizon aggregated information with regard to return, risk, and correlation proves correct, the importance of dividends and dividends reinvested cannot be minimized. Investors shouldn’t accept or settle for a dividend yield in the 1.3% range which places most of the risk on US for a return necessary to meet our pension obligations. Let’s talk.

Like A Bridge Over Troubled Waters – Revisited

I produced the initial “Like A Bridge Over Troubled Waters” post on October 1, 2021. In that post, I highlighted the fact that the decade of the ’00s witnessed two episodic market events that produced nearly -50% declines in each instance crushing pension funding in the process. Most of Pension America had entered the ’00s with well-funded plans, and in many cases, pension systems that enjoyed a surplus. It was truly unfortunate that the focus at that time continued to be on achieving the return on asset assumption (ROA) and not on securing the promised benefits. For if they had adjusted their focus funded status and contribution costs would have been stable. Regrettably, funded ratios plummeted, and in the process, contributions skyrocketed.

The bridge that was referred to in the previous post was an asset allocation framework (not new) that called for plan assets to be bifurcated into liquidity (beta) and growth (alpha) buckets and away from a single asset allocation strategy focused exclusively on the ROA. In this implementation, benefits and expenses would be secured through the investment in a cash flow matching bond strategy that effectively used the asset cash flows from the bonds to meet the liability cash flows. This strategy bought time for the alpha assets to recoup their losses while also allowing them to grow unencumbered, as they were no longer a source of liquidity.

The markets – both stocks and bonds- have enjoyed an incredible period of time since the Great Financial Crisis that ended in March 2009. This period of time has once again created complacency for the plan sponsor and their advisors. Everyone knows that stocks outperform bonds over time (roughly 82% of the time in 10-year periods) and equities generally provide a positive return, so why do anything else – let the good times roll! Well, the growth in contributions from 2000 has been extraordinary despite the “strong” market returns of the last 12 years or so. How is that possible? Think that your system and the fund’s sponsor(s) can continue to support these rapidly growing contributions? Think again!

The chart above is mindblowing! I have realinvestmentadvice.com (who created the graph) and Chris Scibelli, for bringing this to my attention. In our previous post, we talked about a bridge that spanned roughly 12-13 years. Can you imagine being in the midst of a 52-year timeframe in which equities provide no return? How about that incredible stretch being followed by 26-year and 13-year episodes? Do you still think that equity markets (as defined by the S&P 500) always outperform or add value? Do you think that the trend of plowing more and more pension assets into equity and equity-like product makes sense? What if the 39-year bull market in bonds is dead? What if equities are about to produce another -50% decline as the risk-on trade ceases to exist because all the stimulus has dried up?

If these scenarios play out, do you think that Pension America’s DB systems survive? No way! I don’t care if public funds think that they are perpetual. Just because they may be perpetual doesn’t mean that they are sustainable! If you think that the significant increase in contribution expenses witnessed since the 2000 market correction is outrageous, just wait to see what happens when annual contributions become 30% or more of a municipality’s budget.

It is no secret that rates will rise as a result of significant inflation. Bondholders will not continue to buy bonds that have 5% or greater negative real returns. In a rising interest rate environment, both bonds and stocks will be hurt. In that scenario achieving the ROA will be incredibly problematic (impossible?). Most market participants haven’t lived through a bear market in bonds. It won’t be pleasant.

DB pension plans need to be protected and preserved. However, doing the same old, same old, is not the right strategy. Waiting for the markets to show their hand before doing something is like playing Russian Roulette. Now is the time to convert your traditional return-seeking fixed-income assets into a cash flow matching strategy that will use bonds for their intended purpose – cash flow! Bonds are the only asset with a known payout and terminal value. Use those knowns to construct a portfolio that will ensure that you have the assets needed to SECURE the promised benefits when the time comes due to make those payments. Trying to find liquidity in a rapidly deteriorating market environment is as difficult a task as exists.

By having your cash flow-driven investing program matched carefully with your plan’s liabilities, you not only improve liquidity, but you eliminate interest rate risk for that portion of the portfolio, as you will be defeasing a future value that isn’t interest-rate sensitive. Furthermore, you are extending the investing horizon for those alpha assets that need time to grow. They shouldn’t be a source of liquidity. It isn’t too late to adopt, but time to act might be getting short.

Ready for the Weekly ARPA Update?

If given the opportunity to watch paint dry or follow closely the activity surrounding developments related to American Rescue Plan Act (ARPA) and the Special Financial Assistance (SFA), I’d encourage you to sit down and watch some paint. Just make sure that it is a color that you like!

With regard to an update on the progress being made by poorly funded multiemployer plans, there has been ONE pension system, Mid-Jersey Trucking Industry and Teamsters Local 701 Pension and Annuity Fund, that has filed an application with the PBGC in February. The good news is that it is a MPRA Suspension & Partition eligible plan making it the fourth such type to file an application with the PBGC. As a reminder, there are 18 plans that received DOL approval to reduce the promised benefits that are part of the PBGC’s group 2 priority list.

Mid-Jersey Trucking has 1,621 participants in the plan and they have filed to receive $138.6 million in SFA. To date, five plans have had their applications approved and two have received their payments. The pace of approvals and distributions has been slow. Let’s hope that pace accelerates now that we’ve gotten through year-end and the Omicron spike. Lastly, we are still waiting on the PBGC to provide the Final, Final Rules that will govern the implementation of the SFA distribution. I’m at a loss as to why the delay, which is now seven months since the Interim Final Rules were provided in July 2021.