
By: Russ Kamp, CEO, Ryan ALM, Inc.
I was introduced to the St. Louis Fed’s amazing data base – FRED – many years ago by a former Invesco colleague. What is FRED? According to the St. Louis Fed’s website, “FRED is short for Federal Reserve Economic Data, and FRED is an online database consisting of hundreds of thousands of economic data time series (presently >825k) from scores of national, international, public, and private sources. FRED, created and maintained by the Research Department at the Federal Reserve Bank of St. Louis, goes far beyond simply providing data: It combines data with a powerful mix of tools that help the user understand, interact with, display, and disseminate the data.”
FRED is an amazing tool, but the purpose of this blog today is not to laud FRED, but to highlight two data series that I have followed for several years – Real GDP and Real Potential GDP. Real GDP is self-explanatory, but what is Real Potential GDP? “Real potential GDP is the CBO’s estimate of the output the economy would produce with a high rate of use of its capital and labor resources. The data is adjusted to remove the effects of inflation.” The data series starts in Q1’49 and currently runs to Q4’2034, which forecasts Real GDP to be $27.8 trillion at that time. Real GDP is currently (Q4’24) at $23.5 trillion.
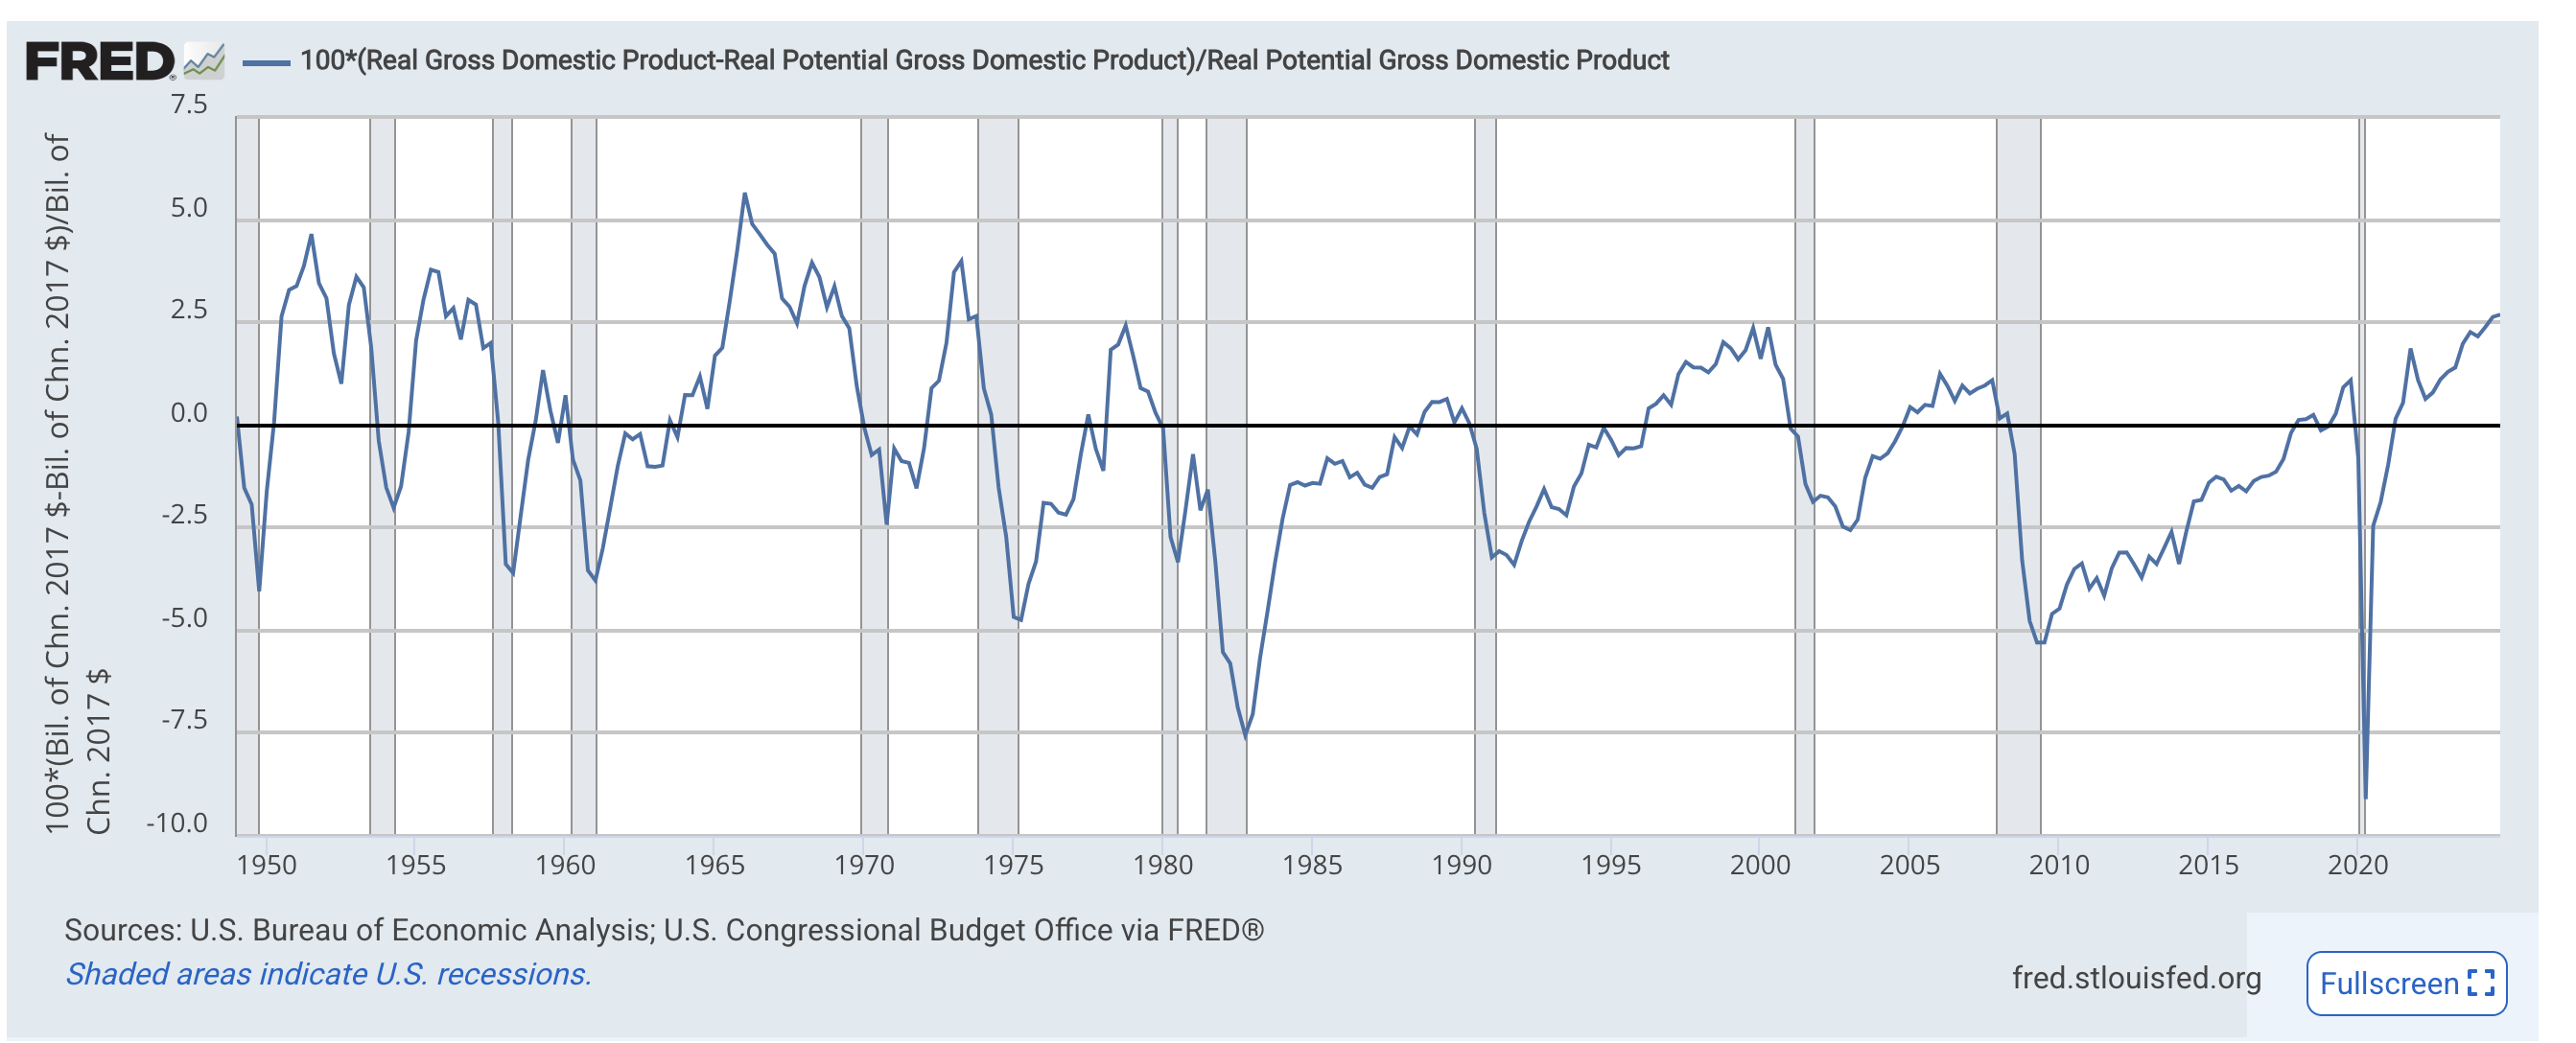
Currently, Real GDP is exceeding what the CBO believes is the Real Potential GDP for our economy by a record amount of $616 billion in $ terms or about 2.5%. If you believe that the CBO’s estimate of potential GDP is close to reality, then it shouldn’t be surprising that inflation remains an issue, despite the marginal improvement disclosed earlier this week (core CPI at 3.1%). As my former colleague and mentor, Charles DuBois has said, “if government spending (or private spending, for that matter) exceeds the economy’s real resources available to absorb that spending, then inflation will likely result.” That’s where we are today, folks.
The growing and fairly consistent fiscal deficit continues to provide stimulus to the private sector (all spending = all income) creating demand for goods and services that exceeds the natural capacity of our economy as measured by the CBO despite the Fed’s aggressive action to temper some of that demand through elevated interest rates, which began in March 2022. While this relationship exists, it makes sense for the Fed to pause its easing of rates, which they seem to have at this time, but we’ll get more insight when they meet next week.
Also reflected in the graph above, previous peaks in Real GDP exceeding the CBO’s Real Potential GDP (’73, ’78, ’89, ’99, ’07) have been followed by economic and market disruptions, some quite significant. What does that portend for today’s market given the current levels?
