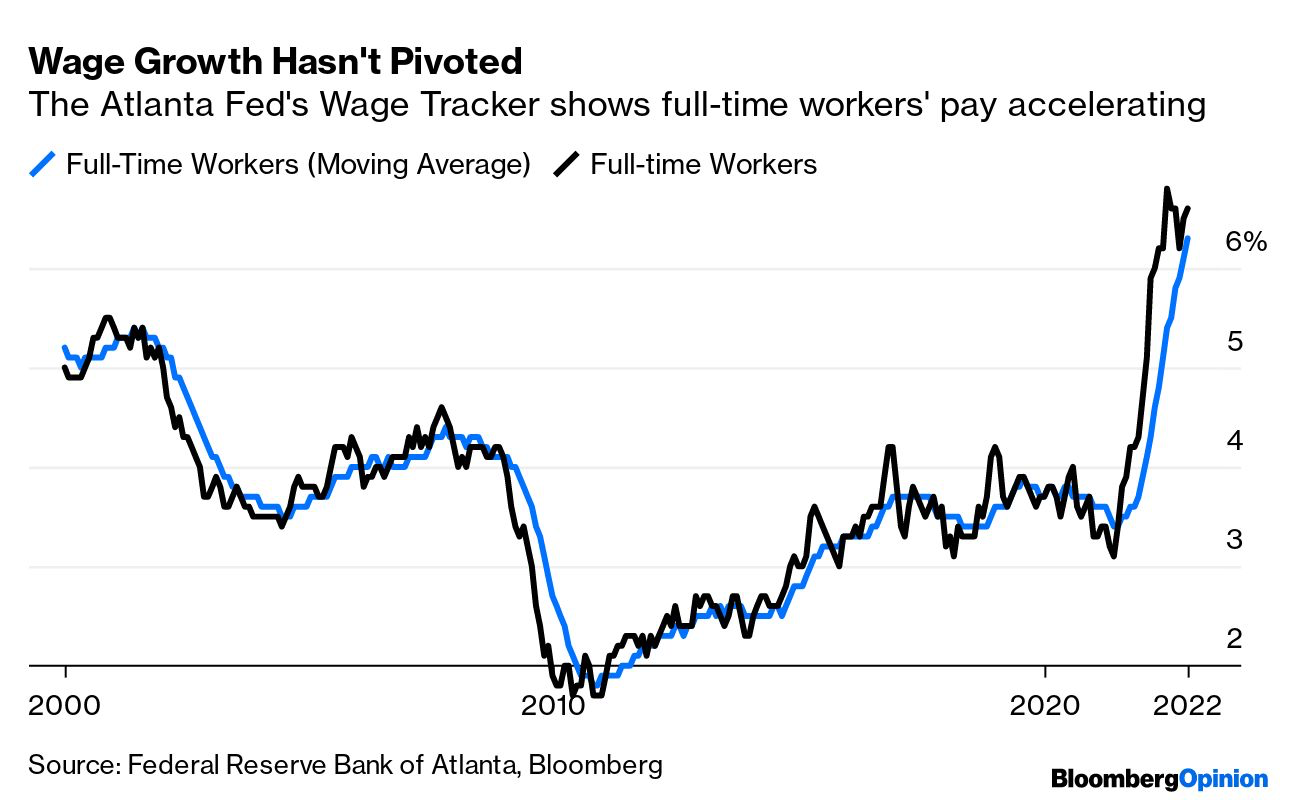
We’ve mentioned “inflation” in 50 blog posts just since July 1, 2022. It is clearly on our minds and the minds of 99% of the investment community. What is our position? We are certainly not in the camp that inflation has been tamed and that the Fed’s 2% target is right around the corner. Our argument is quite basic. Given the strong labor market and rising wages, demand for goods and services will remain strong. Does this mean no moderation in our inflationary environment? No, it doesn’t mean that, but we don’t expect a dramatic reduction in inflation anytime soon, as many on Wall Street are predicting.
As the graph above highlights, wage growth continues to trend upwards. When people are working and earning greater wages, they demand more goods and services. The impact on inflation from Covid-19 production shortfalls and stimulus may be working through the system, but the Ukraine/Russia conflict is far from over and the outcome is certainly not known at this time. These impediments have certainly created supply and demand imbalances, but they are dwarfed in importance by 3.7% unemployment and 6% wage growth. Little evidence exists at this time that would lead one to believe that we are going to see a dramatic collapse in our current labor force. In my post from last week, I highlighted the fact that the Federal Reserve didn’t get its arms around inflation which started to spike in 1978 until 1981 when long rates were near 10% and unemployment was at 8.5%. Our current environment doesn’t come close to reaching those levels.
Lastly, rates have risen from historically low levels, but do you really believe that a 30-year Treasury bond yield of 3.57% (2 pm on the 12th) is going to curtail economic activity? My first house was purchased with a mortgage rate of >11% because I needed a place to live. What we wouldn’t have given to be able to finance that home at 6+%, which is today’s level.
The PBGC certainly didn’t let the upcoming holiday season get in the way of some important business. As we mentioned in last week’s update, there was a potential “tidal wave” of activity facing the PBGC team, as one revised application and 11 supplemental submissions were reaching the 120-day threshold for action. The one revised application was the mammoth Central States plan that received approval for nearly $36 billion in Special Financial Assistance (SFA). The SFA payout is slightly more than $100,000 per plan participant (357,056) and it goes a long way to establishing a firmer financial footing.
The 11 supplemental plans each received approval for their applications. In total, these plans will receive an additional $704 million covering 101,860 plan participants. To date, $45.4 billion has been allocated to 37 pension plans, with Central States representing roughly 80% of the SFA payout to date. Estimates vary as to the ultimate SFA payout, but a safe guess would be that at least 50% of the ARPA proceeds have been allocated and disbursed.
In addition to the activity mentioned above, the New York State Teamsters Conference Pension and Retirement Fund submitted a supplemental application seeking an additional $421.3 million for their 33,643 plan participants. This fund had previously received $963 million as a Priority Group 2 plan. Also, there are two more funds, Teamsters Local 617 Pension Plan and the Graphic Arts Industry Joint Pension Plan, whose supplemental applications are hitting the 120-day window for PBGC action during the next week.
Finally, congratulations to all of those individuals and organizations that worked tirelessly during the last decade-plus to secure the funds necessary to secure the Central States pension system. It would have been so easy to throw in the towel by using MPRA to slash the promised benefits. As a result of this effort, many Americans will once again receive the promised benefits allowing them to begin a more dignified retirement. Great job!
Maybe things have changed during the last 40 years (my hair color certainly has), but there seems to be a major disconnect between the market’s (Fed’s) reaction to the early 1980s inflationary environment compared to the one that we are currently experiencing. Perhaps it is 40 years of falling rates and accommodative Fed policy that have created an expectation that rates will remain low forever, and that the Fed’s only responsibility is to prop up markets at the first sign of trouble. It may be challenging for those engaged in the investment community today that weren’t working in the industry 40 years ago to truly appreciate the actions taken by Paul Volcker and his team to combat historic inflation.
Economic Indicators
1981
2022
CPI
8.9
7.7
Unemployment Rate
8.5
3.7
GDP
2.5
2.9
Comparable inflation
As the data above suggests, inflation today is not too dissimilar to that which we were experiencing in 1981. Sure, inflation has begun to fall from higher levels this past Summer, but it was substantially higher in 1980, too. GDP growth in 1981 compared to today was quite similar. The biggest difference has to do with the current labor market versus 1981, and this is what today’s Fed is focused on. We are near full employment and wages are growing at around 5% annually. The Fed doesn’t believe that inflation can be tamed to any great extent unless we begin to see weakness within the US labor force. Despite aggressive (?) Fed action throughout 2022, unemployment remains stubbornly low. What gives?
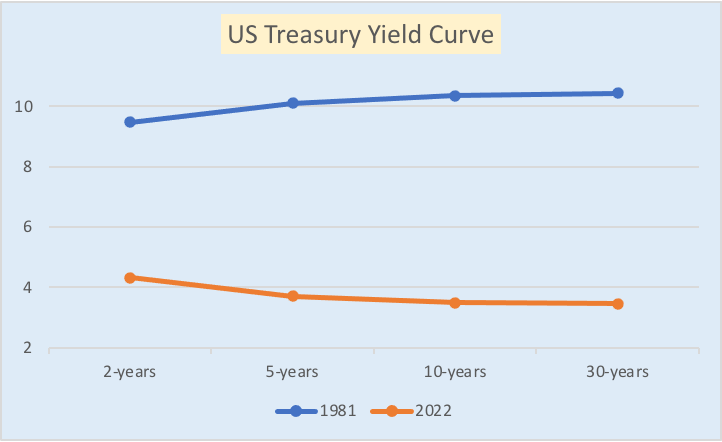
The graph above highlights the US Treasury yield curve for 1981 and 2022. Given similar inflation and GDP data, one would think that US interest rates would be occupying similar levels. But that is far from the case. Market participants today feel that rates have peaked given that inflation appears to be moderating. However, that doesn’t mean that the Fed won’t continue to raise rates in order to achieve a level of “real” rates, which is exactly what Volcker did in the early ’80s. It wasn’t until US interest rates were elevated to a level substantially above the prevailing inflation rate that inflation was finally tamed. Given today’s CPI of 7.7% applying a historic inflation premium (real rate) of 3.1% would push rates above 10% and place them very close to where they were at the end of 1981. Even if inflation fell to 3%, real rates should be at 5% to 6% with an inflation premium of 2% to 3%.
I don’t understand why investors today feel that rates are high. On a relative basis, US Treasuries are well below the long-term average and substantially below inflation. If fighting inflation is the Fed’s primary focus, then they have much work ahead of them. Increasing the Fed Fund’s rate by 50 bps instead of 75 bps is still an increase. Do that another 5-6 times and you’ll finally get rates to a level commensurate with today’s inflation. The Fed pivot doesn’t seem to reflect reality. We can all hope, but hope has never been a successful investment strategy.
Currently, the US 2-year Treasury Note is trading at an 85 bps premium yield to that of the 30-year US Treasury Bond. This inversion doesn’t happen often and has on many occasions predicted a near-term recession. Is 85 bps significant? Well, yes. According to the Ryan ALM Treasury Yield Curve Indexes, -85 bps is the greatest negative yield spread or slope between 2-year and 30-year Treasuries since April 15, 1982, when the spread was -110 bps. The all-time inversion between 2- and 30-year Treasuries occurred on March 20, 1980, when the inversion reached -281 bps.
What I find fascinating is that -85 bps wasn’t breached in 2000-02, 2007-09, or during the initial Covid-19 crisis. Given that the US Federal Reserve continues to suggest that rates will continue to rise in order to thwart inflation, will the -85 bps differential be maintained, expanded, or contracted? Have market participants discounted the strength of the US labor market which currently has an unemployment rate of 3.7%? As a reminder, the US experienced an unemployment rate of 10.8% in 1982 which was more than 3 times as great as that which we are experiencing today. With full employment and wage growth running at roughly 5%, how likely is it that demand for goods and services will be constricted?
We believe that the Fed will not stop increasing the Fed Funds rate until they actually achieve “real” interest rates. According to Yardeni Research, the average inflation premium (real rates) is 3.06% since 1960. What do you think?
We at Ryan ALM, Inc. truly appreciate every opportunity that we get to speak with plan sponsors, consultants, and actuaries. We find the give and take during those conversations to be incredibly educational. During one such recent meeting, we received a question from a plan sponsor that had to do with the trading activity of a Cash Flow Matching (CFM) process relative to a Key Rate Duration (KRD) strategy. This individual assumed that there was far greater activity in a CFM mandate than in a KRD process since we were using cash bonds. That assumption/conclusion is not correct. Yes, a CFM program is going to be dynamic in its responsiveness to actuarial changes, but those usually only happen once per year. KRD products must respond to changes in the level of interest rates and the shape of the yield curve. These adjustments could occur daily.
Furthermore, the beauty of CFM is in the certainty of the outcome. When asked to defease a Retired Lives Liability, the bond portfolio that we construct to match assets to pension liabilities locks in the difference between the present value of the assets and the future value cost of the liabilities at the time that the portfolio is built. Whether rates rise or fall, that relationship and “savings” is secured. Furthermore, the liquidity necessary to make those monthly payments will be available as needed. Unfortunately, there is no such guarantee that the liquidity that is needed to meet payments will be available through a KRD strategy.
Lastly, because CFM is providing the monthly liquidity needed to make each benefit/expense payment, we are providing monthly duration matching. A 30-year CFM program would have 360 unique durations, unlike KRD which picks a modest # of spots along the yield curve. Intrigued? Call us. We wrote the book on CFM.
When multiemployer pension funds submit an application for Special Financial Assistance (SFA), the PBGC has 120 days to act on said application. It just so happens that there are 12 applications that are hitting the 120-day threshold this week with 7 of those slated for today (12/6). This is potentially a tidal wave of activity for the PBGC, which has been handling 1-2 a week, at most. Based on the PBGC’s files, 11 of the 12 applications are supplementing previous submissions. The one non-supplemental application is the massive Central States, Southeast & Southwest Areas Pension Plan, which is seeking nearly $35 billion in SFA support for its roughly 365,000 participants. To put the size of the Central States’ request into perspective, the $35 billion is nearly 4 times greater than the $8.9 billion paid out to date, and it represents just under 40% of the anticipated SFA distributions for the whole ARPA program.
We believe that the applications are approved if no action is taken within the 120 periods. It could be an exhausting week for the team at the PBGC. In any case, it will be a great week for those plans that have asked for additional resources to support the promises made to the plan participants.
With the tryptophan effects finally wearing off, the PBGC is reporting that 2 pension plans – The Defined Benefit Plan for the Operative Plasterers’ and Cement Masons’ International Association Local Union 394 Pension Trust Fund (may just be in the running for the longest pension fund name) and the Retail Clerks Specialty Stores Pension Plan – have filed their initial applications for Special Financial Assistance. These plans are the first of the Priority Group 5 members to file. As a reminder, Priority Group 5 plans are those that are projected to become insolvent before 3/11/2026.
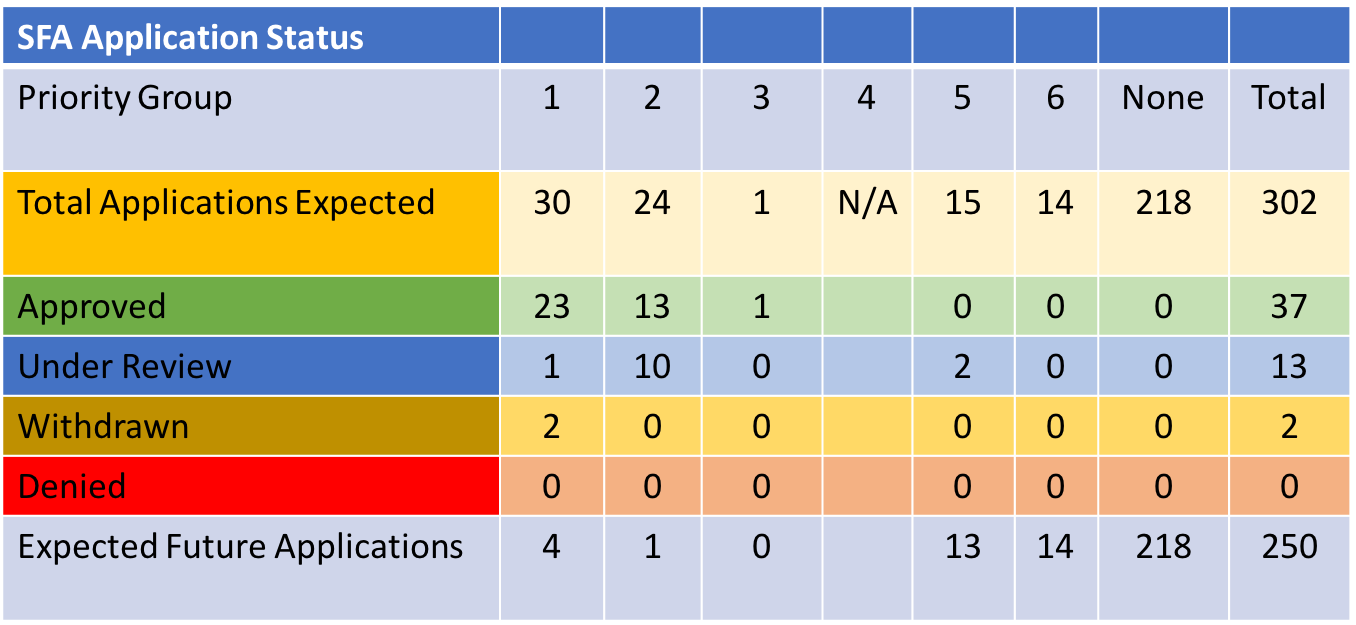
Combined, these plans provide retirement benefits for 1,743 participants. They are seeking $65.7 in SFA. The PBGC is currently reviewing 42 applications, many of which are supplemental filings. Happy to report that there were no applications denied or withdrawn during this most recent weekly period. In addition, the Local 966 Pension Plan, had its SFA application approved. They will receive a little more than $54 million for the 2,356 plan participants.
The information in the chart above does not include supplemental applications
Most fixed-income managers are required to outperform a generic market index benchmark. Usually, it is one of the Lehman, now Bloomberg Barclay’s (BB), indexes designed by Ron Ryan when he was the Lehman Director of Fixed Income Research from 1997-1983. As a result, fixed-income managers have to be concerned and focused on anything that affects the pricing of these bonds such as:
Interest rate sensitivity – bonds are extremely interest rate sensitive which usually accounts for over 90% of their total return. Interest rates are extremely volatile and uncertain not only in levels but in the shape or slope of the yield curve. Speculating on interest rates has been a difficult, if not a losing proposition, for many bond managers so they tend to become closet index fund managers by not straying from the interest rate sensitivity of these indexes… like doing key rate duration matching.
Credit ratings – This is a daunting and constant vigil exercise. S&P, Moody’s, and Fitch tend to upgrade and downgrade 100s of credit ratings each year. Such credit changes lead to bond price changes and total return effects. Fortunately, this volatility of credit changes has not been translated into defaults in the investment-grade corporate bond universe. According to the S&P 2022 Global Default Study, there have been only 4 investment grade defaults since 2010. However, bonds have historically been downgraded to high-yield status (BB, B, CCC) before going into default status.
Call features – since bonds were in a bull market from 1982 thru 2021, many bonds are priced at a premium and are targets of being called. This will reduce the yield and the total return of these bonds.
Total return volatility is in sharp contrast to what Cash Flow Matching (CFM) or Cashflow Driven Investments (CDI) strategies are focused on. CDI is focused on funding benefits in a cost-efficient manner with prudent risk. Benefits are future value payments and as such… benefits are not interest rate sensitive. CDI’s concerns are liquidity and solvency. Liquidity is produced by creating monthly cash flows (interest and principal) that match and fund monthly liability cash flows (benefits + expenses). Fortunately, solvency is a hallmark of investment-grade bonds as the S&P study proves. Ryan ALM further assures solvency thru a series of credit filters such as:
Must be investment grade in the Bloomberg Default Probability rankings
NO YTM outliers of >2 STDs from other credits with similar maturities
NO negative watch or outlook on Moody’s, S&P, and Fitch
NO Baa3 or BBB- bonds
If the true objective of a pension is to fund benefits in a cost-efficient manner with prudent risk… then the Ryan ALM cash flow matching product (Liability Beta Portfolio™) is the best fit.
OOPS! I guess that forecasts anticipating the “collapse” of the US labor market were a bit premature. The announcement that the US added 263,000 new jobs blew away forecasts. The fact that October’s job # was revised to 284,000 new jobs won’t help either. Wage growth increased to 0.6% for the month and last month’s # was revised up by 0.1%. Real Rates? We aren’t close to having real rates. As a result, interest rates are once again rising today after weeks of bonds rallying out of anticipation that the job market was weakening and as a result, the Fed would have to soon pivot. In a post that we recently produced, “Slowing? Possibly.” we highlighted that the Fed was continuing to focus on jobs, wages, and real rates and that a Fed pivot wasn’t likely at this time.
Unfortunately, others didn’t see it that way. It certainly didn’t seem to matter to market participants that the Fed has said repeatedly that they needed to see the EVIDENCE of a weakening labor market, lower wage growth, and a desire to raise rates until a level of REAL rates is created. Clearly, none of that has happened! Yet, until today both equity and bond markets rallied as if all of the Fed’s concerns had been realized. Again, I don’t believe that a Fed Funds range of 3.75% to 4.0% is going to dramatically thwart economic activity. Market participants need to move away from the concept that rates will remain low forever. This Fed seems hell-bent on not repeating the failures of the 1970s to early ’80s Fed two-step. Will market participants and forecasters finally believe this Fed?
Is bigger better? Do firms that have huge research staffs perform better than investment shops that don’t have the same internal resources? How do you know? Where do experience and expertise get factored in? Shouldn’t the firm with the greatest experience and expertise be favored… quality vs. quantity? Have you actually evaluated their security selection relative to a generic universe?
I ask these questions because we’ve had a number of meetings recently in which leading consulting firms have implied that Ryan ALM’s size (four senior asset managers with 168 years of combined experience) is an impediment to our ability to achieve the goals and objectives of a Cash Flow Matching mandate. With only one product (cash flow matching) Ryan ALM has a truly dedicated staff with a wealth of experience. We are asset liability management specialists as our name implies. When you need surgery, we assume you want a specialist to operate on your heart and not a general practitioner.
In one case we conducted a “lunch and learn” for a major consulting organization that asked us to present cash flow matching as they hadn’t been using the strategy since they favored duration matching. We were very pleased to present to roughly three dozen members of their team. Here is a bit of the feedback following our 1-hour meeting. “We appreciate you coming in person to teach and remind us about cash flow matching. A few of us agreed that the cash flow matching approach can be used to mitigate volatility in today’s environment”. However, “for now we are focusing on larger managers where we already have client assets.” My response was, why didn’t those larger managers take the time to remind you about the benefits of cash flow matching instead of doing what everyone else was espousing in terms of using duration matching?
In another meeting, we were told that Cash Flow Matching models are like commodities. That the real value add is in credit research. Really? Have you spent the time to examine the models? Did you ask to see the software that supports each optimization process? I would suggest that you present each of your manager candidates with the same set of liabilities (benefits and expenses) and ask that they produce a portfolio based on that information. I guarantee that there will be differences that might just prove to be substantial. The firm producing the greatest difference in cost between the future value (FV) of the benefits and expenses relative to the present value (PV) cost has the most efficient model. These systems are not commodities! If that were the case, every fixed-income shop would be claiming to have this capability, especially in this market environment in which total return fixed-income products have produced significant negative performance, and will continue to be under pressure as the Fed further tightens rates.
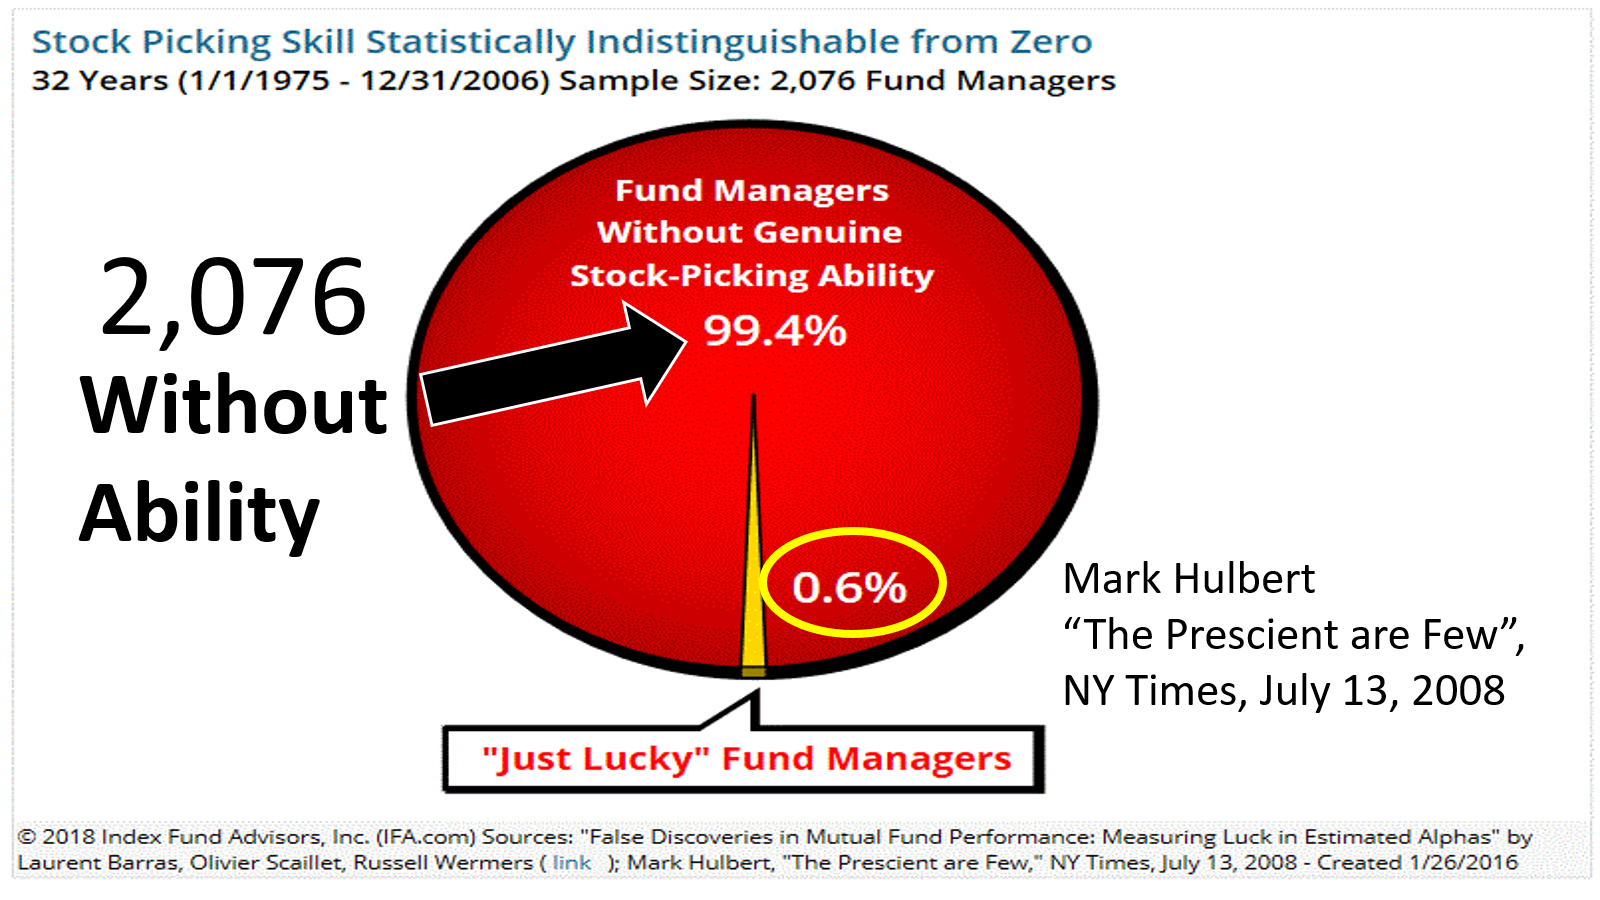
With regard to internal credit research, how valuable is that firm’s investment in internal talent when investment-grade bonds have experienced minimal credit risk during the last four 4 decades? Unlike total return-oriented bond portfolios, duration matching and cash flow matching should be concerned about solvency since you can hold the bonds for a long horizon… maybe maturity. Ryan ALM has had no defaults under our proprietary credit filtering system since our inception in 2005. Have you asked those firms with big internal research departments to provide the value-added achieved from their “greater” security selection? It would be very simple to ask for the performance of their bond universe and then ask for the performance of the subset that was used to construct the client’s portfolio. My guess is that the “value-added” will be quite insignificant. It would likely be insignificant relative to what a firm using the output from the credit agencies, Bloomberg, and other readily available quantitative and qualitative inputs could achieve. Furthermore, human beings possess 23 behavioral traits, many of which work against us as “investors”. It takes a contrarian view to make money yet being a contrarian is very challenging, and has been described as being as painful as chewing off one’s left arm!
As the chart below suggests, there are very few individuals who truly possess the ability to add value through security selection. In this example, we are highlighting the inefficiencies of stock pickers. Do you think that bond managers/analysts have greater skills? I would suggest that the much smaller standard deviation among like bonds makes the task that much more challenging.
In my 41 years in this business, I’ve come to appreciate that there is a natural capacity associated with every investment strategy. Many of the larger firms in our industry have far eclipsed that capacity and as a result, they ultimately arbitrage away the potential value added from their insights. What they’ve proven to be is mostly effective sales organizations. In today’s challenging market environment, we need real solutions provided by true specialists. Size doesn’t matter, but capability and execution do!