Ryan ALM, Inc. Pension Monitor Q4’23

By: Russ Kamp, Managing Director, Ryan ALM, Inc.

We recently shared with you the Ryan ALM, Inc. Newsletter. Attached for you review is the Ryan ALM, Inc. Pension Monitor. This document uses the asset allocation output from P&I’s annual survey of the top 1000 defined benefit plans. Their survey clearly highlights significant differences in the asset allocation of corporate and public DB plans, most notably the exposure to fixed income presumably for hedging purposes.

In addition, we highlight the fact that different accounting rules (FASB vs. GASB) often lead to different conclusions. 2023’s performance differential favoring public plans was significantly smaller than the outperformance of corporate plans in 2022.

As always, we stand ready to respond to any of your questions. Please don’t hesitate to reach out to us if we can help you think through your risk reducing goals. Corporate plans have engaged in these strategies for years and the differential in funded status is stark. The US interest rate environment is providing a wonderful opportunity to take risk off the table without a substantial impact on potential returns.

Ryan ALM, Inc. 2023 Newsletter

By: Russ Kamp, Managing Director, Ryan ALM, Inc.

We are once again pleased to share with you the Ryan ALM, Inc. Newsletter. This edition is a review of 2023. It was a surprisingly good year for Pension America. Markets overcame significant uncertainty related to the Fed’s action related to interest rates, inflation, economic growth, war, etc. Much of the outperformance of plan assets to liabilities is attributable to equities, both domestic and foreign, which enjoyed significantly improved results following 2022’s challenging markets.

US interest rates were on a rollercoaster for a good chunk of the year, as the Fed continued to elevate the FFR to its present level of 5.25%-5.5%. However, during the path upward in the FFR we had markets rocked by the regional banking crisis which sent yields plummeting only to have them reach decade high levels by October. A pause by the Fed with regard to additional FFR increases has convinced many investors that the Fed will now aggressively reduce rates. As a result, the Treasury yields curve dropped since October with most maturities seeing yields plummet by at least 1% to levels below 4%. That action seems premature.

As always, we welcome feedback related to this newsletter. Please don’t hesitate to reach out to us with any questions. We are always available to assist you in thinking through asset/liability issues. May 2024 be your best year yet!

Aggregate Funding hits 100% – WTW

By: Russ Kamp, Managing Director, Ryan ALM, Inc.

I recently reported on Milliman’s Corporate Pension Plan Index that indicated aggregate funding for the top 100 plans had settled at 102% at the end of November. Today, P&I ran a report form Willis Towers Watson (WTW), that suggested that the aggregate funding for 358 of the Fortune 1000 companies with a defined benefit plan had reached 100%, up 2% since the end of 2022. Both reports are highlighting considerable strength for Corporate America’s pension funding. Great!

Now what?

After a great 2021, we asked not only what Corporate America would do regarding their pension systems, but pension plans in general including public and multiemployer. Unfortunately, they didn’t do much and the Fed’s aggressive interest rate moves beginning in March 2022 created a lot of angst and uncertainty for sponsors and large drawdowns in asset values. The rising rates led to a significant reduction in the present value of those future benefit payments or the funding situation would have been much worse.

Well, 2023 was a surprisingly good year for pension plans from both an asset and liability standpoint. Will plan sponsors and their advisors work to protect the gains or will they once again allow the markets to dictate the funded status? We believe that a defined benefit plan is superior to a defined contribution plan. We believe that they act as great recruiting and retention tools. As a result, DB plans need to be protected and preserved. SECURING the promised benefits at a reasonable cost and with prudent risk should be the goal. Chasing a return through a traditional asset allocation only leads to excessive volatility in contributions and funded status.

US interest rates are still at very attractive levels. Take advantage of this environment to secure the promised benefits through a defeasement strategy. Use your current bond allocation to match bond cash flows with liability cash flows (benefits and expenses) chronologically as far into the future as the allocation will permit. Your fund will now have the necessary liquidity to meet your monthly needs, while buying time (extending the investing horizon) for the plan’s alpha assets to grow unencumbered.

ARPA Update as of December 29, 2023

By: Russ Kamp, Managing Director, Ryan ALM, Inc.

Happy New Year! I hope that your 2024 is filled with great health, prosperity, joy, and friendships! Higher US interest rates would be welcomed, too, as that makes managing defined benefit pensions and the Special Financial Assistance (SFA) much easier.

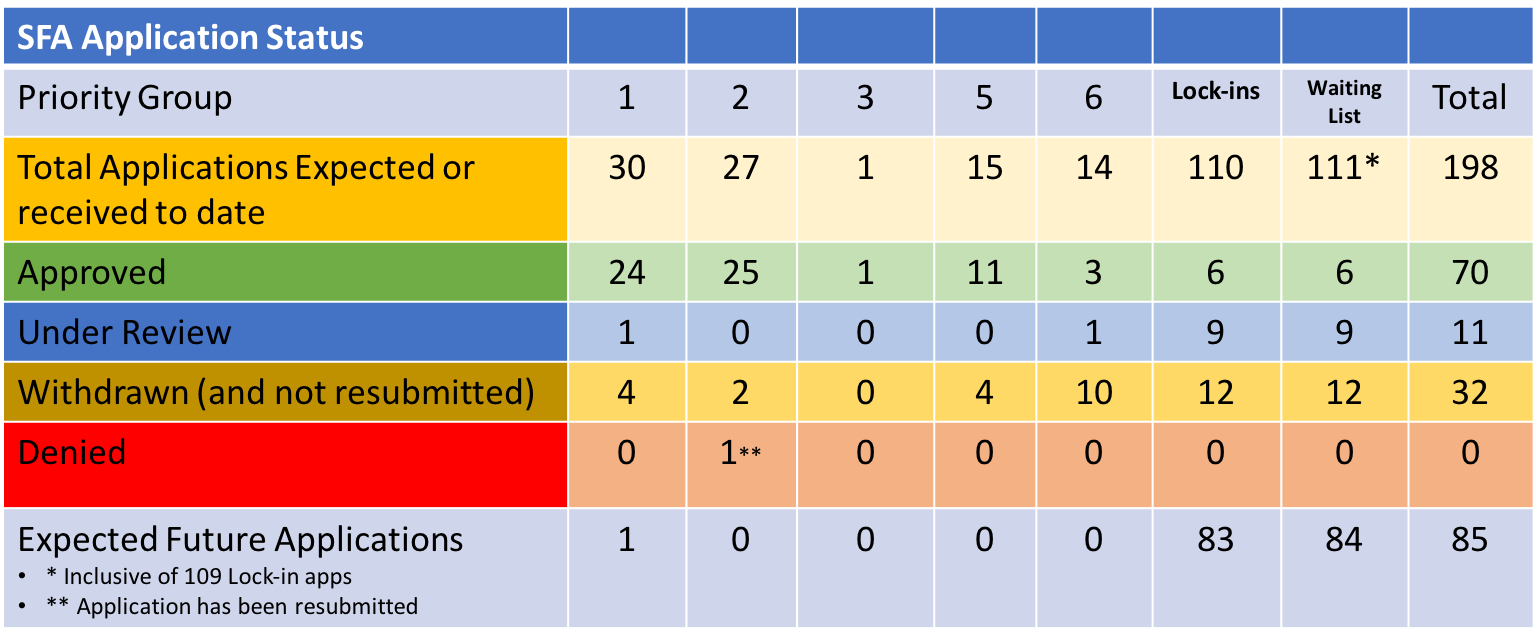
With regard to the PBGC’s implementation of the ARPA legislation, they reported (12/29) no activity for the week. So, no new applications received, denied, approved, and no new pension funds added to the waiting list, which hasn’t seen a new addition since 8/23. Here is the current status of the activity:

There remains a ton of work before the PBGC can declare an end to this process, as only 69 applications have been approved to date, which is 35% of the 197 total applications that will eventually be processed. Importantly, those 69 approved plans have received $53.5 billion in SFA.

Did The Investing Community Get too Far Ahead of the Fed? – Continued

By: Russ Kamp, Managing Director, Ryan ALM, Inc.

As I posted on December 19, 2023, I believe that the investing community has gotten too far ahead of the Fed with regard to potential interest rate policy changes in 2024. The move down in Treasury yields of more than 100 bps across the curve has been incredible. Despite this rapid repricing, the current Fed Fund Futures are anticipating 6 rate cuts in 2024. Given the strength of the US economy, labor force, and significant deficit spending, how realistic is that expectation? Furthermore, given that 2024 is a presidential election year, will the Fed act aggressively leading up to November?

If history is our guide, it is not likely that we will see the Fed insert themselves into the campaign. The Fed has set the explicit Fed Funds rate since 1994. How many times in those nearly 30 years have they changed rates during a presidential election year? The answer is only 3 times – 1996, 2008, and 2020. In 1996, they cut one time by 25 bps in January and were finished for the year. In 2008, they drove rates to zero in reaction to the Global Financial Crisis, and in 2020 they reduced rates from 4% to zero as the impact of Covid-19 and the pandemic took hold.

Based on this history, it will take a nearly unprecedented event to see the Fed act to the extent that is currently priced into the market, especially given the current expectation of a “soft” landing. Furthermore, it has been an extremely rare event to have the Fed cut US interest rates when the labor market has been this strong and unemployment <4% (currently 3.7%). Yet, market participants continue to drive Treasury rates lower as witnessed yesterday, when the yield on the 10-year note fell another 11 bps.

According to Jim Bianco (and shared by Steve DeVito, Ryan ALM’s Head Trader), a move of that magnitude is incredibly rare. Here are the observations during the last 62 years:

December 29, 2010 = -0.13% to 3.3489%

December 28, 2007 = -0.12% to 4.0732%

December 27, 2001 = -0.13% to 5.0650%

December 30, 1991 = -0.11% to 6.7160%

December 31, 1981 = -0.19% to 13.9820%

December 26, 1980 = -0.17% to 12.2520%

The yield on the 10-year Treasury note sits at 3.82% this morning, which is down 117 bps since late October. With Core inflation remaining at 4% and proving to be quite sticky, “investors” are accepting a real yield that is negative when compared to core inflation. As Ron Ryan pointed out recently in his blog post, the 10-year note has provided investors with a real yield of between 2% and 3% dating back to at least 1953. Given the Fed’s target of 2% core PCE would suggest nominal 10-year Treasury rates of 4.0% to 5.0%. Investors hoping to get a return greater than the current yield may be in for quite the surprise.

It’s Ugly, and It Isn’t Getting Any Better!

By: Russ Kamp, Managing Director, Ryan ALM, Inc.

Americans nearing retirement are in most cases unprepared for the hopefully next 20-25 or more years. Sure, there is Social Security (thank goodness), but the average monthly SS payment is only $1,827 or $21,924 per year. When you figure that the average rent for an apartment is $1,372 per an August 2023 review by Apartment List, that doesn’t give the SS recipient a lot of disposable income. In addition to housing costs, Seniors need to be concerned about healthcare costs that tend to dominate expenditures during one’s later years. There are obviously many other regular expenditures, including food, transportation, clothing, etc.

According to the Bureau of Labor Statistics, the “average” 65-year-old had an annual expenditure of $57,818 as of 2022. What is the median average income for Americans of a similar age? Unfortunately, it is only $50,290 (U.S. Census Bureau), including SS and any and all retirement accounts (DB, DC, IRA, ). So, before the year even begins, the average American 65-year-old or older is behind the 8 ball by more than $7,500, and that is before the potential extraordinary expense that could further sabotage one’s retirement.

This is bad, and the story is getting worse. According to Benzinga, the average American retiree had <$171,000 in retirement savings, but 37% of Americans have saved nothing for retirement, which is an increase of 7% just since 2022. In addition, 71% of Americans are carrying non-mortgage debt in retirement of just under $20,000. Student loan debt (Parent Plus Loans) and medical expenditures are contributing to this burgeoning total. In many cases the lack of retirement resources has been the result of an early retirement brought about because of a disability rendering the possibility of working beyond 65 a moot point.

Again, asking employees with little discretionary income, no or little investment acumen, and a cloudy crystal ball to help with planning until one’s demise makes the use of defined contribution plans a silly alternative to traditional defined benefit plans as one’s primary retirement plan. As an FYI, my Mom and Dad have lived on my Dad’s small DB monthly payout ($1,400ish), Social Security, and a little savings for 32+ years. They have never been wealthy, but they’ve been secure in knowing that that check will arrive every month. My Dad is now 94. I can’t imagine that he would have been able to afford a retirement in which he had to “manage” monthly distributions for the last 3+ decades and hopefully more to come.

The higher US interest rate environment has reduced the present value (PV) of those future value (FV) benefit payments promised by sponsors of DB plans to their plan participants. Perhaps this development will encourage plan sponsors to maintain, if not reopen, their DB plan. The current American retirement landscape is not good, and it will only continue to get worse, as members of younger cohorts (Millennials, Gen X, and Gen Z) move along toward their retirement age. Unfortunately, these generations have been burdened with greater expenses associated with education, childcare, and housing affordability. Funding a retirement account becomes such a secondary consideration to just being able to make ends meet.

ARPA Update as of December 22, 2023

By: Russ Kamp, Managing Director, Ryan ALM, Inc.

We at Ryan ALM, Inc. wish you and your family a joyous holiday season and an incredible 2024.

Once again, there isn’t a lot to report on the activity of the PBGC as they implement the ARPA legislation. There were no new applications submitted. Nor were there any applications approved or denied. However, there was one application withdrawn, as Teamsters Local 11 Pension Plan withdrew their previously revised application. This non-priority plan is seeking nearly $29 million for its 2,012 participants. Perhaps the third time will prove to be the charm.

In addition to the one withdrawal, there were two plans that received payment following approval of their applications. Twin Cities Bakery Drivers Pension Plan and United Association of Plumbers and Pipefitters Local 51 Pension Fund received their funds ($26 and $16.5, respectively) on December 21st. The SFA payments will help support the pensions of 2,587 plan participants. Congrats!

We anticipate a tremendous level of activity in 2024, as implementation of the legislation enters its third full calendar year. As the chart above highlights, there are still nearly 90 plans expecting to secure some SFA. Good luck.

When It Stops Nobody Knows

By: Russ Kamp, Managing Director, Ryan ALM, Inc.

I am preparing for a session that I will conduct in late January for the FPPTA. I’ve been asked to speak about US equity indexes, which I’ve done before despite my current role at Ryan ALM, Inc. It is a fun topic and I’ve evolved it over the years to use index performance as a predictor of future relative performance. As most everyone in our industry appreciates, we have two primary equity cycles involving Growth and Value and Large cap and Small cap. The style cycles are driven by economic conditions, but often exacerbated by fund flows. We do have a tendency in our industry to overwhelm ideas and opportunities through massive asset movements.

I’ve written a bit recently on the current state of domestic US equity. Where large cap growth and the S&P 500 are significantly outperforming small cap value, as the “Magnificent Seven (M7)” large cap tech companies become an ever-bigger percentage and influence within these two cap weighted indexes. Currently, the M7 are >30% of the S&P 500 and have a combined market cap that is greater than the UK, France, Japan, and China! The question that everyone should be asking is if this level of concentration and superior performance is sustainable?

As my graph above highlights, we’ve witnessed boom and bust cycles for both Large Growth (R1000G) and the S&P 500 before. Both experienced superior outperformance versus Small Cap Value (using the R1000V index) at periods ending March 1999 and September 2020. The gradual climb to those peaks took years, but the reversal was incredibly swift. Once the momentum was wrung out of those stocks the relative performance reversal came on like a bullet train.

In fact, it only took 19 months from the peak achieved by Large Growth vs. Small Value (relative outperformance for 12-months of 50.14%) to have that relative performance erased. It only took another nine months for Small Value to have outperformed Large Growth by an incredible 66.98% over the previous 12 months. This pattern was once again on display and magnified by Covid-19. For the 12 months ending February 2019, LG had outperformed LV by 2.2%, while the S&P 500 had only beaten the SV index by 0.26%. During the next 19 months, and fueled by the Pandemic, these two indexes outperformed by 50.41% and 30.03%, respectively.

But investors shouldn’t have gotten complacent, for within 6 months of reaching peak relative performance, Small Value would outperform Large Growth by 34.3% and the S&P 500 by more than 40% as of March 2021. Oh, my. The relative performance reversal was incredibly swift and relentless.

Where are we today? As I stated earlier, Large Growth and the S&P 500 have both dramatically outperformed Small Value by 30.9% and 18.57% through November 30, 2023 on a 12-month trailing basis. We aren’t near previous peaks achieved in the past, but the outperformance is certainly meaningful. What will be the catalyst that reverses the current trend? Will it be the fact that the economy is actually performing better than expected and we are not likely to see a significant recession? I’m not smart enough nor is my crystal ball any clearer than yours, but I would suggest that taking profits off the table from Large Cap growth and the S&P 500 and redeploying those assets into Small Cap Value is likely to reward pension plan sponsors during the next equity cycle or get really radical and take domestic equity profits and use the proceeds to defease your Retired Lives Liability (RLL) chronologically from next month as far into the future as that allocation will go.

Will The Fed Get “Real”?

By: Ronald J. Ryan, CEO, Ryan ALM, Inc.

Chairman Powell and the Fed have been steadfast in their stated goal of 2.0% inflation as measured by Personal Consumption Expenditures (PCE). The November PCE was announced today at 2.6% YoY. The Fed also has consistently expressed a goal of real rates or the inflation premium. The Fed has not announced a target real rate but the historical average is about 3%, as suggested in the chart below.

Indeed, most pensions have an inflation premium built into their plan’s projections of about 3%. But let’s assume that 2% is an acceptable Fed real rate target. That would suggest nominal rates of about 4.6% on the 10-year Treasury. Currently, the 10-year Treasury is at 3.86%. As Russ suggested in a blog post from earlier this week, has the investing community gotten ahead of themselves? If PCE inflation went to 2%, a real rate of 2% would suggest a 4.0% nominal 10-year Treasury, which would be slightly above where the market is today. This reality would not suggest interest rates should trend lower in 2024.

The question remains… where will inflation (as measured by the PCE) level off? Who knows… there are too many factors to consider. With durable goods coming in at 5.4% increase for November, two wars being financed and an election year looming, it is hard to suggest a recession is forthcoming. But why speculate on interest rates. With interest rates so much higher than they were in the last 10 years, why not defease Retired Lives? The value in bonds has always been in the certainty of their cash flows. Use bonds for their value and defease the most certain liability cash flows (Retired Lives). The Ryan ALM cash flow matching model (Liability Beta Portfolio™) can reduce funding costs by about 2% per year (1-10 years = 20%).  

Did the Bond Market (and Investors) Get Ahead of Itself?

By: Russ Kamp, Managing Director, Ryan ALM, Inc.

It wasn’t two months ago that Treasury yields were approaching or had breached 5% across the yield curve. Today, those yields are just above or below 4% for maturities 3-years and out. What changed? Clearly, the Fed’s messaging has indicated to the investment community a sea change related to future interest rate moves. But what has changed from an economic perspective to warrant such a dramatic move? US employment remains near historic levels. Labor participation rates are growing. Wages are increasing at a decent rate. The US economy continues to outperform expectations. Core inflation remains elevated at nearly 2X the Fed’s 2% target. Where is the long-anticipated recession? Oh, and by the way, housing starts blew away expectations today at 1.56 million units when 1.36 million were anticipated. This is the most activity since May 2023, and the lower mortgage rates (7.34% from the peak at 8.28%) might just continue to thrust housing forward.

Was the reaction to the Fed’s third consecutive meeting pause an overreaction? Is the expectation among investors that the Fed’s next move must be to reduce rates a reflection of living with 40-years of Fed easing anytime that there was a wobble in the investing world? Has the potential Fed easing in 2024 been fully priced in already and what might that mean for bond investors as we go through 2024 and beyond? Are you confused yet? Well, that isn’t surprising since most of us have never been through a protracted secular interest rate rise such as the one experienced from 1953 to early 1982. Well, as the chart below highlights, you aren’t the only one who is uncertain as to where US interest rates might be at the end of 2024. Thanks to the following Bloomberg chart that my college Steve DeVito (Ryan ALM’s Head trader) grabbed from LinkedIn.com, it seems like strategists on Wall Street are also at odds with one another as to where rates are going.

I suspect that if this chart had been produced at the end of October 2023, there might be greater unanimity as to the future direction of rates given that the 10-year Treasury yield was at nearly 5% at that time. At 3.89% (10:24 am EST on 12/29) there is far greater uncertainty. Again, given the economic backdrop, why should the 10-year be trading at a negative real yield to US core inflation?

There is some speculation in the market that the significant rally in bonds was partially fueled by hedge funds unwinding their short future positions, which had been significant since the Fed began raising rates. I think that there is some merit in that opinion despite not having position reports to support that thought. It just doesn’t seem that the current economic environment would support such a robust drop in rates just because the Fed refused to elevate rates for the third consecutive meeting.

Given the uncertainty in today’s market, why make an interest rate bet? Being long fixed income benchmarked to the BB Aggregate Index is an interest rate bet. The plan sponsor and their consultant believe that at worst rates will remain at this level in which the manager will capture the yield of the portfolio. If rates were to fall there might be some appreciation (on paper at least) to go along with the interest. However, if the market has moved to quickly and created in the process an overbought US bond market (at least Treasuries) the possibility of capital depreciation exists should rates reflect the current environment and not some future state that might not be achieved.

Take this opportunity of higher rates and use corporate bonds to defease your plan’s Retired Lives Liability (RLL) chronologically as far into the future as your bond allocation will cover. Given that benefit payments are future value promises they are not interest rate sensitive. No guessing or hoping needed. The cost reduction to defease the plan’s liabilities is locked in on day one of the strategy being deployed. How comforting would it be to know that no matter what transpires in the capital markets your plan participants will receive their promised benefits. It is very easily arranged and quite cost effective. Give your DB plan participants a Christmas present by defeasing your liabilities while reducing funding costs with certainty.