
By: Russ Kamp, Managing Director, Ryan ALM, Inc.
US interest rates have risen dramatically from the historic lows achieved during the initial stages of the Covid-19 crisis. Interest rate moves, particularly among shorter Treasury maturities (5 years and less) have moved up by more than 300 basis points. For Treasuries longer than 5 years, the interest rate increases have been >240 bps. The US interest rate cycle that produced a nearly 40-year bond bull market has been squashed and it will likely be some time into the future before we see rates ease significantly, as the Federal Reserve continues to have as its primary objective the tamping down of our current excessive inflation.
Despite the significant move in rates, we believe that there is much more for the Fed to do, as real rates remain dramatically negative (-5.23% versus today’s yield on the US 10-year Treasury Note). Furthermore, the move up in rates has Treasury yields still positioned substantially below the averages for the last 46 years. The chart below was produced by Ryan ALM’s Head Trader, Steve DeVito. The data is from 11,564 daily observations. All Federal bank holidays and weekends during the 46 years were removed as the markets were closed and the daily yields over long holidays were just repeated from the last day the bond market was open.
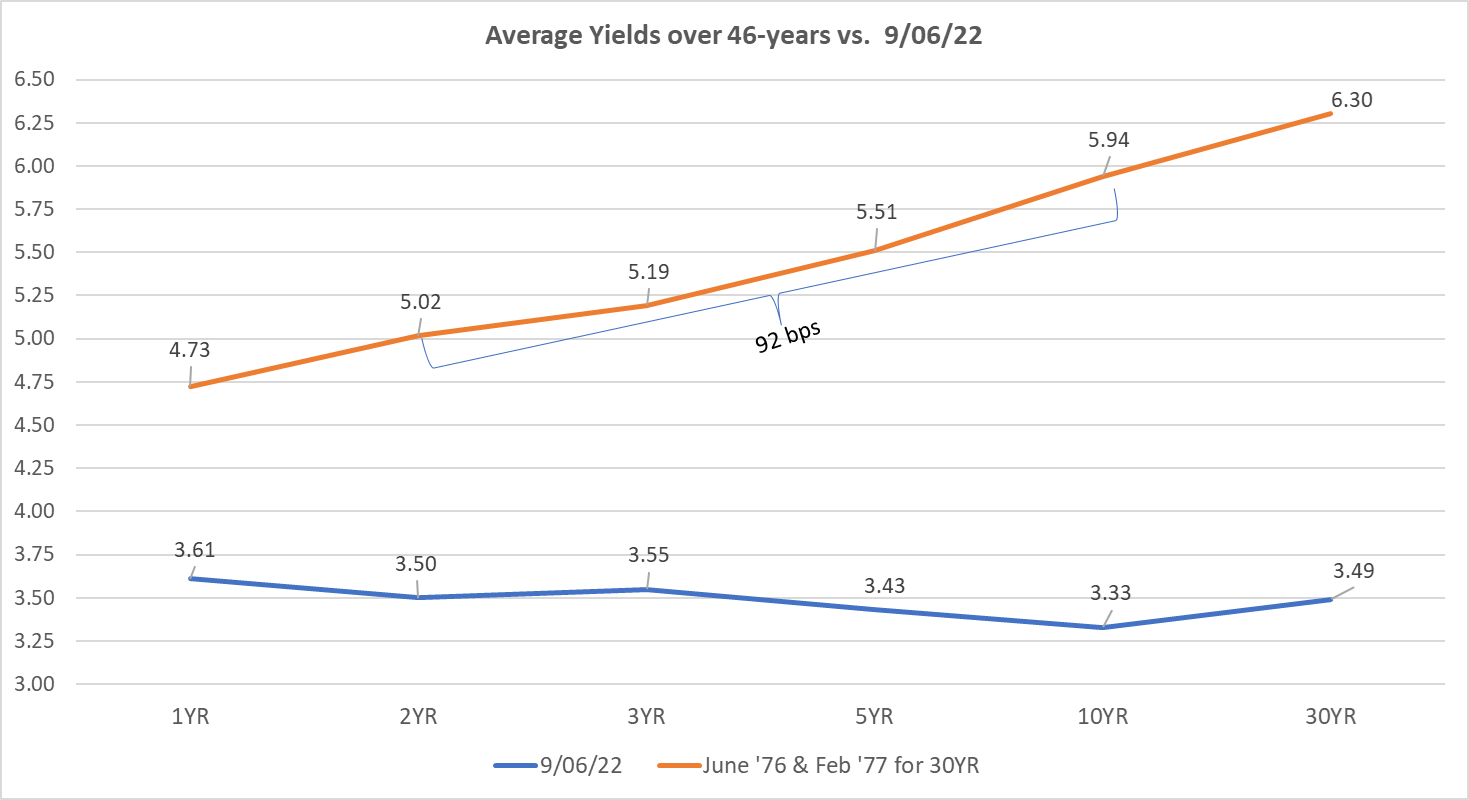
As one can clearly see, both the flatness of the curve and the low level of rates indicate a very different environment for the US Federal Reserve to try to use monetary tools to fight this inflation battle. The Fed has been consistent in its messaging despite many market participants not believing that rates must rise to a level that thwarts economic growth and drives down employment. Just getting the 10-year Treasury yield back to the last 46-year average would necessitate an increase of 260 bps from the current levels. Oh, my! As a reminder, a bond with a 10-year duration would suffer a -10% principal loss with every 1% rise in rates. That might be good for pension liabilities but it could be devastating to fixed income funds focused on achieving a return versus a generic index.
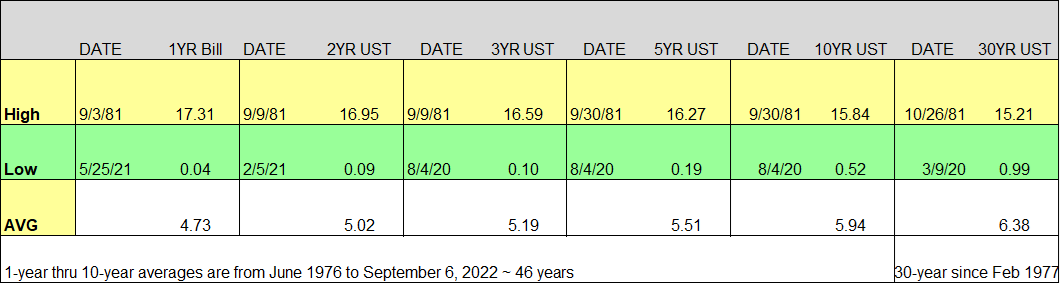
In order to provide some context, Steve also looked at the range of rates at each maturity bucket during this 46-year period. The highs and lows are extremely dramatic, and each reflects a point in time in which our economy was experiencing crisis conditions. The high levels were the result of incredible inflation during the late ’70s and early ’80s that make our current environment pale in comparison. It took extraordinary courage by Fed Chairman Volcker to crush that inflationary environment. Does this Fed possess the same resolve? The lows were the result of the closure of our economy during the initial reaction to the Covid-19 pandemic when roughly 30% of our workforce was temporarily sidelined.
The Ryan ALM crystal ball is no better than anyone else’s, but history does have a strange way of repeating itself. I’m certainly not comfortable stating that rates will follow a similar path to 1981’s peak, but in cases of great unknowns, falling back on the averages is a pretty good tool. In this case, the averages portend much more pain for the investment community. Are you prepared? Lastly, we believe that Ryan ALM produces the most complete data on the Treasury yield curve through the Ryan Indexes. Interested? Please let us know how we can assist you.
