
By: Russ Kamp, Managing Director, Ryan ALM, Inc.
As a child playing football, I was told to look at my opponent’s belt buckle when going to make a tackle, so as to avoid head fakes. Well, market participants cheering yesterday’s inflation news might do well to heed this advice, as head fakes occur in the capital markets all the time. What would be the equivalent of focusing on the opponent’s belt buckle? In the inflation case, perhaps we should avoid the headline # of 8.5% and focus more attention on those components that continue to highlight significant inflationary pressures such as food and housing. Also, the 8.5% CPI number is still significant, as wages continue to fall substantially below that level at 5.2% YOY growth.
The graph below highlights the path that inflation took during the 1970s into the early ’80s. In August 1972, before Tug McGraw would famously chant “You Gotta Believe” in reference to the NY Mets going from bottom dwellers to the World Series, annual inflation would bottom at 2.95%. It would continue an unabated rise “peaking” 23 months later at 11.54%. Following that month (July 1974), the annual CPI would fall to 10.89% or -0.65% in one month – sound familiar? Did that occurrence represent the beginning of the end for inflation – NO! As August’s CPI quickly rebounded producing a 1.06% increase to an annual rate of 11.95%. Inflation wouldn’t peak until November of 1974 at an annual rate of 12.2%.
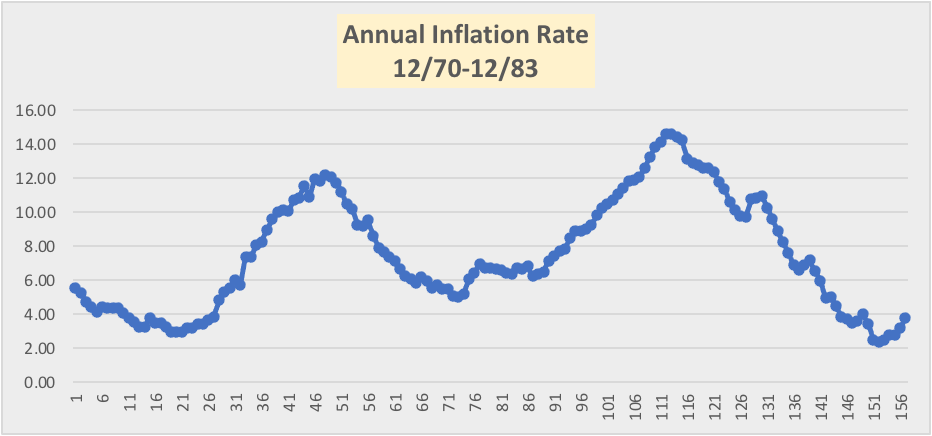
In an attempt to thwart these inflationary pressures, the US Federal Reserve would raise the Fed Funds Rate (FFR) to 16% by March of 1975. However, they would dramatically reduce the Fed Funds Rate in April down to 5.25%, as inflationary pressures were subsiding – was that action premature? Inflation would fall precipitously from that November peak in 1974 to a bottom in that cycle in December 1976. However, the low annual inflation # was still at 5.04%, or 2.5 times where the Fed would like to see inflation today. Regrettably, inflation once again took off eventually peaking at 14.6% in April 1980. However, despite increasing the FFR to a whopping 20% in the month prior to the peak, it would have to revisit that extraordinary level on several occasions during the next couple of years.
Where did inflation go following these unprecedented moves? Well, it didn’t plunge. In fact, it took 3 years and two months to finally have inflation post a number that began with a 2! Inflation would eventually bottom out at an annual rate of 2.36% in July 1983 before once again ascending. Market participants that believe a Fed Funds Rate of 2.25% will quickly extinguish our current inflation have not studied past cycles. One should realize that unemployment touched 10.8% in 1982! With current unemployment at 3.5% and annual wage growth of 5.2%, just how much economic activity will be tamped down by our current levels of interest rates? I suspect very little. Don’t let one month of “falling” annual CPI rates cloud your judgment. History suggests that we are in for quite the rollercoaster ride.

I like the fact that the news is about the year ending July rather than the month of July, which had zero CPI. Zero breeds the feeling that it’s over. I tried to explain the difference to my bride last night. She doesn’t get it.
She’s not alone, Ron! I can’t believe how many “investors” feel that the Fed will have to start easing soon! What have they accomplished?
The “Taper Tantrum” of 2013 sets precedent, but inflation was low then. Untapering today will fuel inflation because ZIRP requires lots of money for its manipulation.
True – furthermore, there just isn’t any justification to ease policy with unemployment at 3.5%, strong wage growth, and a rising LPR.