
Longview Economics produced the graph below, which appeared in John Authers’ (Bloomberg) post today.
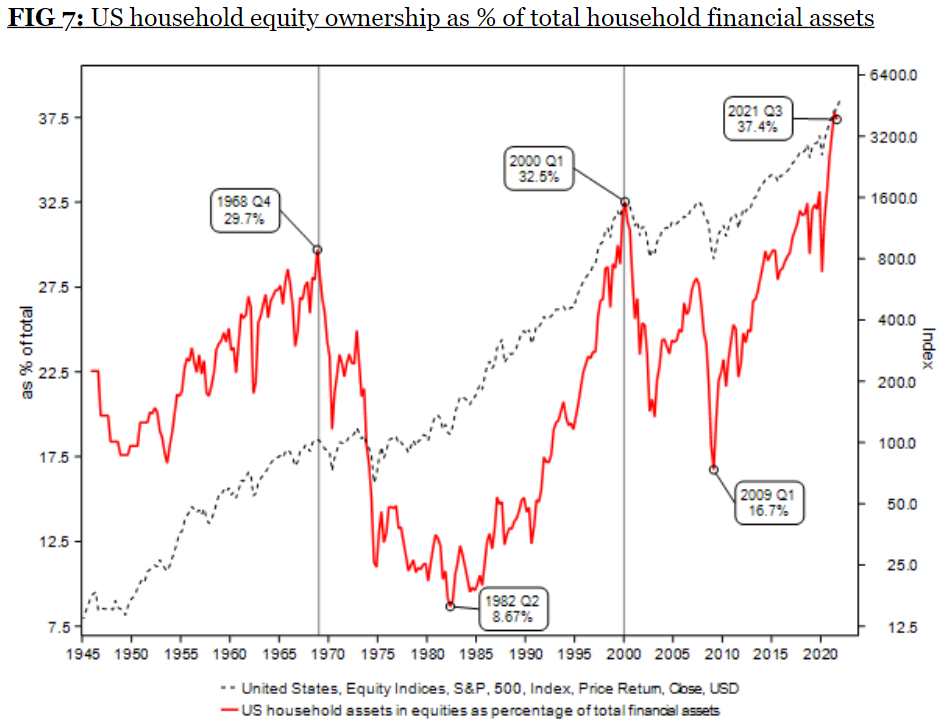
It certainly appears that the average US household is “all in” on equities! Previous peak ownership coincided with the massive unwinding of these positions from 1968 to 1982 and again from 2000 to 2009’s bottom. The unwinding that occurred during the decade of the ’00s witnessed two nearly 50% declines that wiped out incredible wealth, while significantly impairing the funded status for Pension America. Could we be on the cusp of a similar outcome? Will rising US interest rates be that catalyst? We’ve begun to see a great unwinding of historically low global short rates with the value of bonds with negative real rates is now at only roughly $6 trillion from an incredible $19 trillion in 2021.
As I reported earlier this year, inflows into US equity funds in 2021 (>$900 billion) eclipsed the total sum from the prior 19 years combined! Where is the fuel needed to sustain current levels of equity valuation? Will households maintain their current levels of ownership or will they begin to unwind? If the great unwinding occurs will it test the previous lows and what will that mean for US and global equity markets. Worse, what will it mean for our pension system that has made terrific strides in recent years to improve the long-term sustainability of these critically important programs?
Now is the time to rethink your asset allocation strategy, not once the household ownership is nearing levels last seen in early 2009. Secure those promised benefits by converting your current return-focused fixed income exposure into a cash flow matching program where assets and liabilities are carefully synchronized.
