
In our December 3rd blog post, “Tough Sledding Ahead?”, we highlighted the CAPE index while raising concerns that equity valuations appeared stretched based on this metric. As you may recall, the forecast equity return was -2.3%, including dividends. As a follow-up to that post, we would like to highlight this sobering chart:
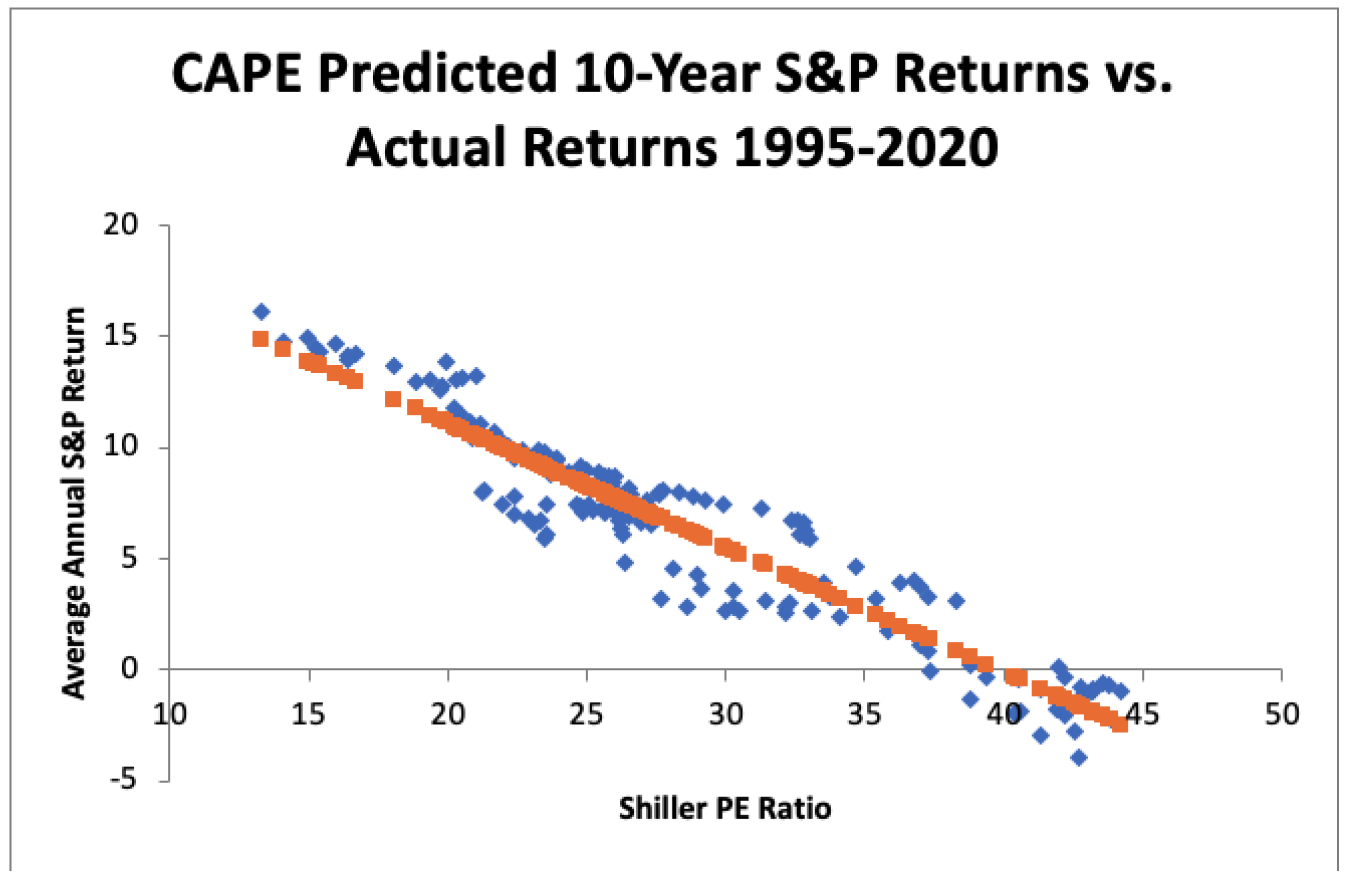
John Authers, Senior Editor at Bloomberg, published this chart in his daily Point of Return newsletter. He got the chart from a Michael Finke article that was published by Advisor Perspectives in July 2020. The chart shows that the CAPE has been incredibly accurate in predicting future 10-year equity returns even without taking bond yields into account. According to Finke, a higher CAPE meant a lower subsequent 10-year return, and vice versa. The R-squared was a phenomenally high 0.9, which explained 90% of stocks’ subsequent performance over a decade and the standard deviation was ONLY 1.37%. This 25-year period has been a roller coaster for markets, as we’ve witnessed an equity bubble (’90s), a credit bubble (’07-’08), two epic bear markets (it feels like we’ve had more than two), and a decade-long bull market that recently went pop!
As if that isn’t enough to possibly shake the confidence of your favorite pension plan sponsor in being able to achieve the return on asset assumption (ROA), we also wanted to mention that the Buffett Indicator, which is the ratio of the total market capitalization of the US equity market ($45.2 T)/US GDP ($21.7 T) is currently at 203%. This is 71% above the long-term average. The only other time that had this level of richness was the top of the technology bubble in March 2000 (also at 71% above average).

So, why is buying time important? If in fact the US equity market is peaking, the next 10-years could be quite troubling. If equities are a source of funds to meet future benefit payments, being a forced seller in this environment may create further downward pressure on your holdings. By implementing a cash flow driven investing (CDI) approach that insulates your fund by defeasing the Retired Lives liabilities with bond cash flows (next 1-10 years), your alpha or growth assets, including US stocks, now have significant time to wade through the periods of poor performance. They are allowed to grow unencumbered, as they are no longer a source to fund benefits and expenses. We believe that adopting a new asset allocation framework that consists of beta (CDI) and alpha (growth) assets is the most prudent approach to managing pension assets. Given the current environment any delay in adopting this structure may prove detrimental to the long-term health of your pension plan.
