Ryan ALM, Inc. Pension Monitor YTD 2023

By: Russ Kamp, Managing Director, Ryan ALM, Inc.

We are pleased to share with you the Ryan ALM, Inc. Pension Monitor for YTD 2023. As you will see, the differences among public and corporate funding results for the first 6 months of 2023 are far smaller than those experienced during 2022’s volatile year, when corporate plans outperformed public plans by an incredible 31.4%.

So far in 2023, corporate plans slightly underperformed public plans as US interest rate declines YTD had a marginal impact on private pensions that operate under FASB accounting standards. In addition, asset allocation differences in exposures to both public bonds and equities further contributed to the 2.4% outperformance of public plans versus corporate plans. Public pension plans have much more modest exposures to fixed income and far greater exposure to public equities vis a vis an average corporate asset allocation structure. With US equities, as measured by the S&P 500 up nearly 17% YTD, public plans have captured more of that return.

As always, please don’t hesitate to reach out to you with any of your questions or visit RyanALM.com to see the plethora of research that we’ve produced for your benefit.

How’s Your Liquidity?

By: Russ Kamp, Managing Director, Ryan ALM, Inc.

I’ve been enjoying my time at the Opal Public Funds Summit East conference in Newport, RI. Day two has been illuminating, especially as it relates to real estate and the lack of liquidity available from “open-end” funds. One of the plan sponsors that I spoke with has been waiting on a queue for 10 months at this time with no information on when the first distribution may become available.

As we at Ryan ALM, Inc. have mentioned many times, current asset allocation models within DB plans have significantly impacted the availability of liquidity to meet monthly benefits and expenses by migrating significant plan assets to alternative investments, including real estate, without a formal plan to meet ongoing liquidity needs. We believe that having all of a plan’s assets focused on the return on assets (ROA) assumption is the wrong approach. Plan sponsors and their advisors should bifurcate the asset base into two buckets – liquidity and growth.

The liquidity bucket should be a defeased bond portfolio through a cash flow matching (CFM) strategy focused on near-term liabilities chronologically, while the growth bucket can be invested as aggressively as allowed by the IPS with a much longer investing horizon as it will no longer be a source of liquidity. The rising US rate environment is creating challenges for many aspects of our capital markets but a blessing for fixed income assets used as liquidity to fund benefits + expenses. DB plans should be striving for less uncertainty by focusing more attention on the benefit promises that have been made to the participants and less on the potential return.

As a reminder, the only reason that these DB plans exist is to meet a benefit promise that has been made to the participants. Providing the necessary liquidity to meet those promises should be a major consideration. Bonds are not a return-seeking asset. They are the only asset with a known cash flow (terminal value + contractual interest payments). Use the certainty of those cash flows to SECURE the promised benefits. Everyone will sleep better at night!

ARPA Update as of July 7, 2023

By: Russ Kamp, Managing Director, Ryan ALM, Inc.

The PBGC didn’t let a little holiday get in the way of some ARPA activity last week. According to the terrific spreadsheet that they update and provide weekly, three more plans received approval for SFA grant monies. These plans include, Automotive Industries Pension Plan (Priority Group 6), Western Pennsylvania Teamsters and Employers Pension Fund (PG 2), and the Retail Clerks Specialty Stores Pension Plan (PG 5). In total, these plans will receive $1.42 billion for their combined 46,076 plan participants. The Automotive plan will receive just over 76% of the total grant money.

In other ARPA news, the Retirement Benefit Plan of the Newspaper and Magazine Drivers, Chauffeurs and Handlers Union Local 473 (quite the mouthful) became the sixth plan on the waiting list to have their application reviewed. The PBGC has 120 days from July 5th (11/2/23) to complete its review of the SFA application. There remain 104 plans on the wait list.

The United Food and Commercial Workers (UFCW) Union and Participating Food Industry Employers Tri-State Pension Plan withdrew its application on July 3rd. This Priority Group 6 plan is seeking $651 million for their 29,233 participants.

I’ve mentioned that the Bakery Drivers Local 550 and Industry Plan remains the only applicant to be denied. Here is the letter from the PBGC explaining why this fund was not eligible to receive SFA grant money.

Lastly, the US interest rate environment continues to support the use of cash flow matching to ensure that the promised benefits and expenses stretch as far as possible within the SFA bucket. These sinking funds should not be investing in return seeking assets (RSA) as the purpose is to lock in the B&E coverage as far into the future as possible. As we’ve mentioned previously, the sequencing of returns is critically important to the success of this legislation. Now is not the time to take on risk. Save that for the legacy assets that now have time to grow unencumbered.

And Then There is Gen X

By: Russ Kamp Managing Director, Ryan ALM, Inc.

As a follow-up to the blog from Friday, Transamerica Center for Retirement Studies and Transamerica Institute released a retirement preparedness study this past Thursday. None of the four generations studied – Boomers, Gen X, Millennials, and Gen Z – are in good shape, but the Gen X folks are in the most dire situation. They are often referred to as the “sandwich” generation as a result of beginning their careers in the 80s and 90s when DB plans were being phased out and before DC plans were widely understood and offered.

According to the Transamerica study, only 17% of the Gen X cohort (born 1965-1980) believe that they are adequately prepared for retirement, and they are right based on the fact that the median retirement household savings is only $82,000 compared to Boomers at $289,000. Early Gen Xers are not to far off from beginning to “retire”, but can they?

I’m highlighting the Gen X group, but none of the four generational cohorts are in good shape. Somewhat surprising is the Boomers confidence level at only 21%, as many (not most) had exposure to a DB plan, while 27% of Millennials and 23% of Gen Z members feel prepared. That means that a whole lot of Americans (70+%) don’t feel that a retirement is in their futures, let alone a dignified one. So sad!

How’s This Social Experiment Working?

By: Russ Kamp, Managing Director, Ryan ALM, Inc.

The great migration from defined benefit (DB) plans to defined contribution (DC) plans has been underway for roughly four decades within the private sector. How’s it working out for the millions of US workers hoping to retire one day? Will their “golden years” be bright and shiny or tarnished as a result of asking untrained individuals to fund, manage, and then disburse a “retirement” benefit with out the financial resources, skill, or crystal ball to accomplish the objective?

So, how are our DC participants doing? According to Alight’s recently released 2023 Universe Benchmarks report, NOT WELL! Among more than 3 million participants that were surveyed, the median balance of only $23,818 is at its lowest level in more than a decade. Sure, new participants are coming into the survey all the time and they tend to have shorter working histories and smaller balances, but before you believe that this is the primary reason for the meager balances, participants across all timelines suffered significant declines in 2022 as balances fell -14.7% on average.

In addition to reporting on the median account balances, Alight’s survey also pointed out that average participation and contribution rates declined. One in 5 of Alight’s participants had a loan outstanding, but that is down from a peak of nearly 30% about a decade ago. When looking at the average balance, which clearly favors those of higher incomes and longer tenures, 2022 wasn’t much better as the average balance fell $111,210 from $114,280 at the start of the year. For even those with more robust balances, relying on a balance of this size will unfortunately not produce a dignified retirement for the participant.

Let’s hope that the combination of the “Great Resignation” and the generation of pension income in 2022 will slow down the termination of more DB plans within the private sector. We, at Ryan ALM, believe that DB plans are an incredible retention tool. We also know that there are strategies (namely cash flow matching) that can secure the promised benefits at reasonable cost and with prudent risk, reducing the potential for negative shocks to the corporation’s income statement. US workers need our help if they are going to achieve the dream of a dignified retirement. Doing the same old, same old is not the right approach.

What Pivot? An Update

By: Russ Kamp, Managing Director, Ryan ALM, Inc.

I recently produced the following on LinkedIn.com.

What PIVOT?

As we’ve been consistently saying, economies don’t roll into recessions with full employment and wage growth >4%. Recent economic releases continue to support the Fed’s aggressive rate increases with more likely to follow.

The US 2-year Treasury Note yield is back at 4.87% this morning. It is within 20 bps of the peak yield achieved earlier this year. Furthermore, it is up 110 bps since days following SVB’s collapse and the perceived end of the banking industry.

US interest rates are not high enough to thwart economic growth. If you were involved in our industry in the late ’70s and early ’80s you witnessed high double-digit rates.

There has perhaps never been a decade like the ’90s for investing in US equities – S&P 500 compounded at 18.5% for the decade. Yet, the 10-year Treasury yield averaged about 6.5% for that period ranging from a low of 4% (1998) to a high of 9.5% (1995). The 10-year US Treasury Note yield is ONLY 3.83% this morning, even after a 12 bps rise following the GDP upward revision. STOP looking at the movement from Covid-19 induced lows. Focus on the absolute level of US Treasuries at this time. It won’t cloud your judgment.

Following today’s release of ADP’s National Jobs Report (497,000 vs. 220,000 expectation), I produced a follow-up thought.

Interest rates are rising significantly this morning following the blowout jobs #. Just one more data point crushing the “pivot crowd”.

2-year Treasury Note yields are up 9 bps (as of 9:33 am) and sit at 5.04%. This is only 3 bps off the peak yield achieved earlier this year and 1.26% higher than the low achieved after SVB’s demise. US 10-year Treasury Note yield is back over 4% for the first time in months.

Good news: Higher yields are providing pension plan sponsors of all kinds (corp, public, and multiemployer) with the wonderful opportunity to significantly reduce risk by cash flow matching plan liabilities and assets at a very attractive Yield To Worst (YTW). Don’t let the markets dictate your funded status and contribution expenses. Take risk off the table today.

ARPA Update as of June 30, 2023

By: Russ Kamp, Managing Director, Ryan ALM, Inc.

Happy Fourth of July! Thank you to all who have served our nation to provide us with the freedoms that we enjoy, but often take for granted.

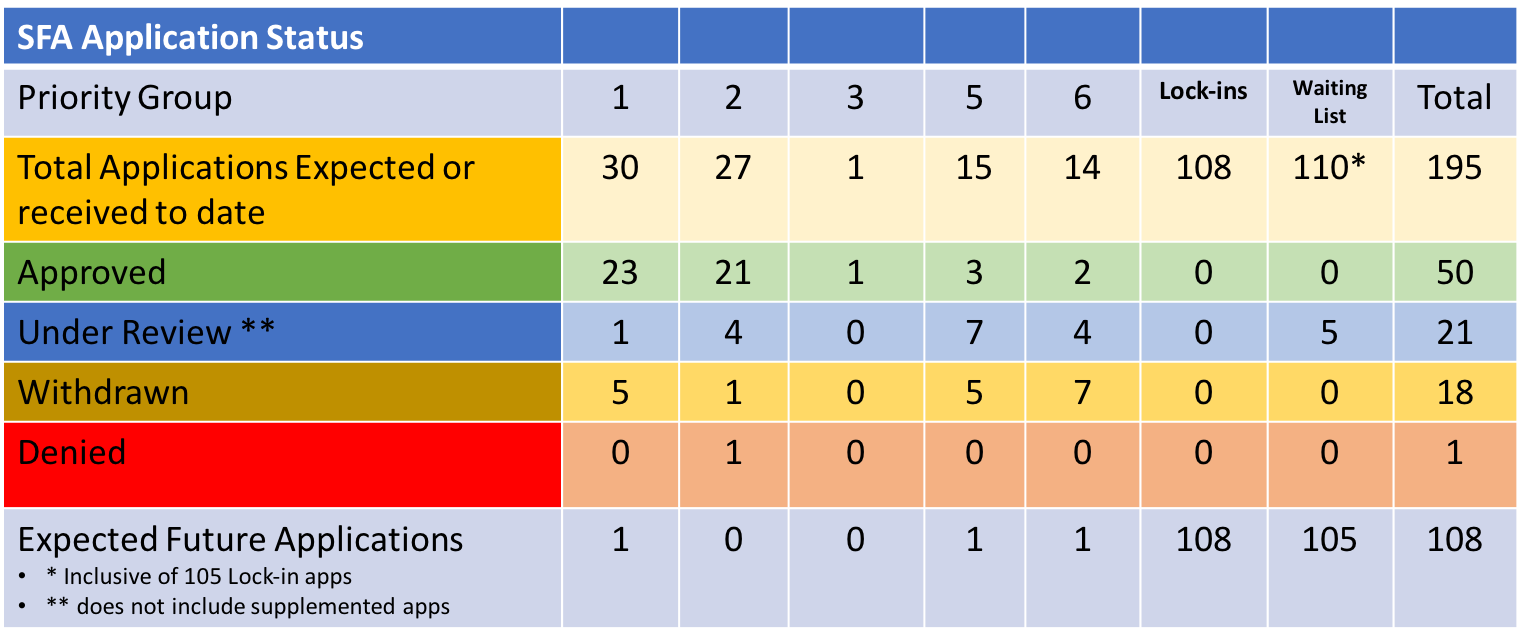
With respect to the PBGC’s implementation of the ARPA pension legislation, last week was quite busy, as five plans had their applications approved, including the first two Priority Group 6 members to get the SFA grant award. The National Integrated Group Pension Plan and the PACE Industry Union-Management Pension Plan will receive approximately $2.2 billion to cover their 112,776 participants.

The Composition Roofers No. 42 Pension Plan and the IBEW Local No. 237 Pension Plan, Priority Group 2 members, each had revised applications approved during the last 7 days. They will receive in total $65.9 million (including interest) for their 925 members. The last of the five approved applications was for supplemental proceeds for Priority Group 2 member Bricklayers and Allied Craftsmen Local 7 Pension Plan, which will get $9.4 million for its 397 pensioners.

In other news, three plans withdrew applications, presumably under the guidance of the PBGC. These plans, the Pension Plan of the Moving Picture Machine Operators Union Local 306 (PG 5), GCIU-Employer Retirement Benefit Plan (PG 6), and Local 210’s Pension Plan (PG 5), were seeking $944 million collectively, with a significant majority of those assets earmarked for the GCIU plan. GCIU’s application was their initial one, while the other two had already submitted revised applications. Perhaps three times will prove to be the charm.

There were no additions to either the waiting list or locked-in groupings. There still remain 110 waiting list candidates of which 108 have locked in their valuation date. As we begin the Fourth of July celebrations, we should also celebrate the fact that 50 multiemployer plans have received critical funding to help meet the promises that were given to their plan participants.

The Funded Status Should Drive Asset Allocation

By: Ronald J. Ryan, CFA, CEO, Ryan ALM, Inc.

Q:  Should a pension plan with a 90% funded status have the same asset allocation as a 60% funded plan?

A:  NO! Asset allocation should be based on the economic funded status.

Many asset allocation models are based on achieving a target return (ROA) and ignore the funded status. This has been a critical mistake as best demonstrated by what has happened since 1999. In the 1990s, most pensions had a growing surplus. Instead of reacting to this funded status, most pensions focused on achieving a then target ROA of around 8.00%. During the 1990s, asset allocation models increased their weight for equities and reduced their weight toward fixed income to the lowest level ever as interest rates continued a secular decline. By the end of 1999, it was common to see an allocation of 75%+ to equities.

When the equity correction came in 2000, it hit the funded status hard. Ryan ALM estimates that the S&P 500 underperformed economic liability growth by over 60% during the 2000 – 2002 equity correction. As a result, the funded status went from a nice surplus to a sizeable deficit. This reality caused a spike in contribution costs. For many pensions, contribution costs went up over 300% in those three years and they have continued to spike through today. Contributions for many pensions are now over 10x higher today than in fiscal 1999. This is the pension crisis I outlined in my 2013 book “The U.S. Pension Crisis”. This increased contribution cost led numerous corporations to freeze and terminate their defined benefit plan through a pension risk transfer (PRT). This may be the worst outcome for new employees who were given a less secure defined contribution plan instead.

There are several lessons to be learned from the 2000-02 equity correction:

  1. True Economic Objective – is to secure benefits in a cost-efficient manner with prudent risk… it is not a return objective.
  2. It’s All about Cash Flows – the goal is to have asset cash flows match or exceed liability cash flows with certainty. This should be the quest of any pension. This is best accomplished with a cash flow matching strategy using bonds. It used to be called Dedication and Defeasance.
  3. Actuarial Projections – the actuarial projections of benefits and expenses or liability cash flows should be the focus of asset cash flows. Too often such actuarial projections are not provided in the annual actuarial report. It is critical that pension assets know what they are funding. As a result, actuarial projections should be mandated by the plan sponsor, so consultants and asset liability managers know the liability cash flows they need to fund.
  4. Economic Funded Status – actuaries have a tough and tedious job given all the calculations they need to create. As a result, they tend to publish their actuarial report annually several months after the end of the fiscal year. It is hard, if not impossible, for assets to function efficiently if their objective is only known annually several months delinquent. As a solution, the Ryan team developed the Custom Liability Index (CLI) as the proper benchmark for any pension providing all of the calculations and data needed for plan sponsors, consultants and asset liability managers to perform their duties effectively. The CLI will calculate the market value of liabilities so the economic funded status can be determined when compared to the market value of assets. This economic funded status should be the focus of asset allocation.
  1. Asset Allocation – should be responsive to the funded status. As the funded ratio improves, a greater allocation to cash flow matching with bonds should be enacted. Any pension fully funded should consider a high cash flow matching allocation. Utopia is to have risky assets in the surplus portfolio and not the asset liability portfolio. Had pensions done this in the late 1990s there would not have been the contribution cost spikes pensions suffered ever since.  

“Common sense is not common. It requires preferred sense”.