
BY: Russ Kamp, Managing Director, Ryan ALM, Inc.
We understand that US public pension systems operate under different accounting standards (GASB) than those sponsored by private companies (FASB), but should those differences create asset allocation frameworks that differ so widely from those of corporate plans? Furthermore, those differences create much greater uncertainty, as the public fund’s larger exposure to equities and equity-like alternatives magnify the annual contribution and funded status volatility. Just how different are they?
The first graph highlights the asset allocation for US private plans from 1990 into 2023.
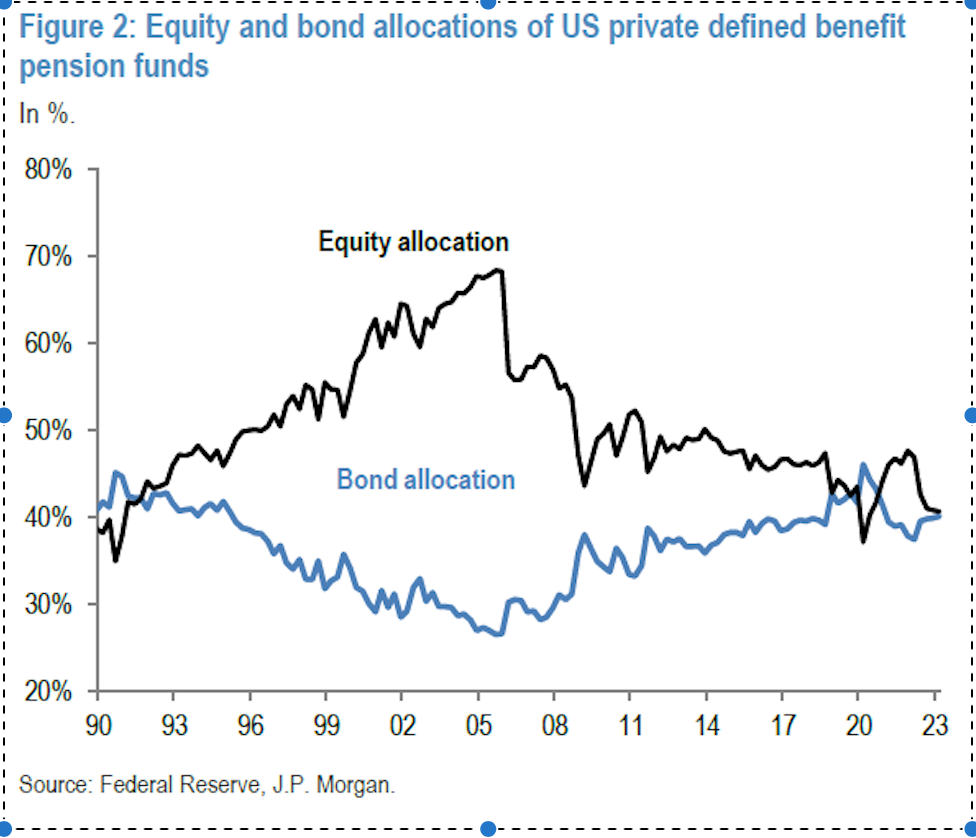
As one can see, equity exposure grew steadily from the 1990s into 2007, before falling rapidly until today, where equity exposure mirrors the bond allocation. Some of that movement was driven by the tremendous returns achieved during the go-go ’90s, followed by the collapse of those markets in 2008. Today’s allocation is mostly driven by a desire to stabilize the funded status (and contribution expenses) for either a possible pension risk transfer (PRT) or minimization of PBGC premium expenses, or both.
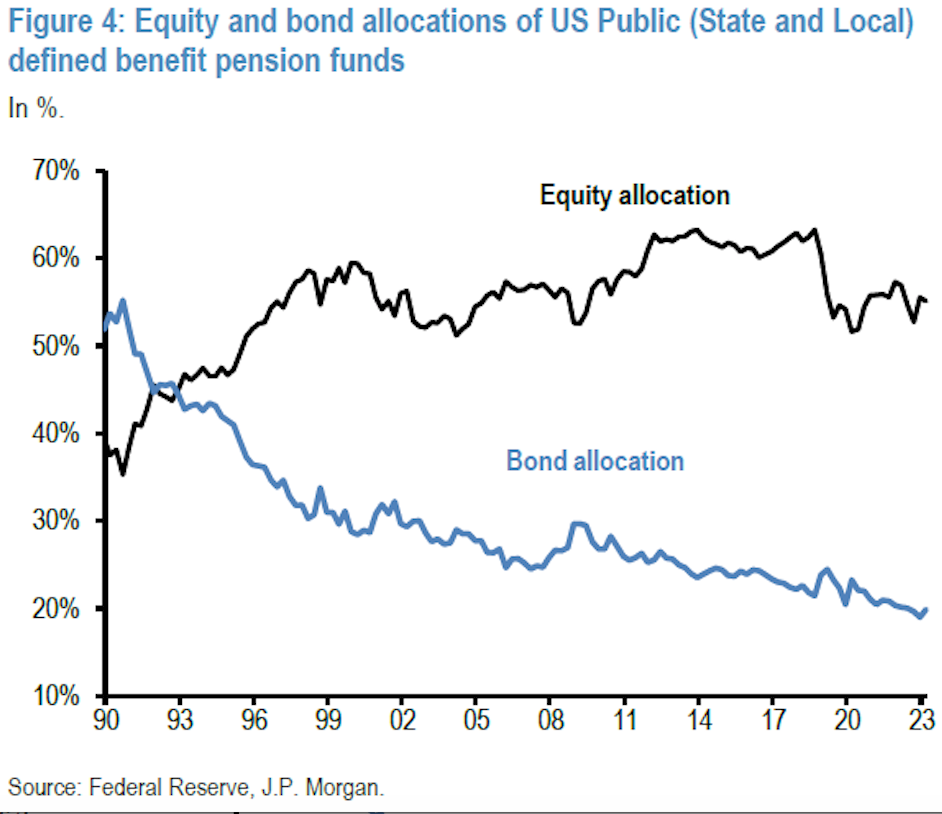
On the other hand, public funds which started at very similar equity exposure in 1990, have adopted a much more aggressive, almost let-it-ride mentality. As the graph below reveals, equity exposure resides in the mid-50% range or about 15% above that of private pensions. At the same time, exposure to bonds has plummeted declining more than 60%, as alternative investments have taken on a greater role. Has this shift improved funding?
Both private and public plans had the opportunity to significantly reduce the volatility around the funded status back in 1999, following the historic equity market. Both sets of pension funds were overfunded on average, but neither plan type took advantage of their favorable funded status to SECURE the promised benefits by defeasing the pension promises. As a result, both asset bases became victims to two incredible bear market events – 2000 to 2002 and 2007 to 2009. Since the devastating Great Financial Crisis, corporate America has steadily reduced exposure to equities, while increasing bond exposure. As a result, the fund status for the average private fund is presently at 99.3% and the funding deficit is only $8.9 billion as of December 31, 2022, for the largest 100 plans (according to Milliman’s 2023 annual study). Finally, the discount rate is 5.18%.
On the other hand, public pension funding continues to be incredibly volatile. According to Milliman and their 2023 public fund report on the largest 100 public pension systems, the aggregate funded ratio has fallen to 72.6%, erasing the market gains experienced in 2020 and 2021. Furthermore, the 2022 market underperformance has widened the funding gap between plan assets and liabilities to a new high of $1.63 trillion as of December 31, 2022. The discount rate is in most cases equivalent to the plan’s return on asset assumption (ROA) of roughly 7%, or 1.82% higher than that of private plans. This suggests that if public pension plans would mark to market their liabilities using ASC 715 discount rates (AA corporate bonds) the present value of their liabilities would increase by 18% to 27% (discount rate difference of 1.82% x duration of liabilities (10 to 15 years))… and their economic funded ratio would decline from 72.6% to between 57.2% to 61.5%.
As US interest rates rise, the new investing environment is providing pension America with a second opportunity to substantially reduce risk which will help to stabilize the funded status and contribution expenses, while buying time for the equity and equity-like exposure to grow unencumbered. Will plan sponsors take advantage of this new paradigm, or will we continue to witness significant market volatility whipsaw the funded status and contribution expenses for primarily public plans?
We suggest that public pension systems adopt an asset allocation that resembles private plans. Increase the allocation to fixed income, especially now that an investment-grade corporate bond portfolio’s YTW can earn roughly 78% of the ROA with little risk. Use the bond allocation to defease your plan’s near-term Retired Lives Liabilities chronologically which will improve liquidity, while also stabilizing the funded status for that portion of the portfolio that is now carefully matched to the plan’s liabilities. By buying time, the equity and alternative exposure can grow unencumbered and be used to meet future liability growth.
Pension systems need to be protected and preserved. Continuing to ride the asset allocation rollercoaster is not the way to protect plans. Adopt a greater focus on risk reduction and securing the plan’s promises and preservation of these incredibly important vehicles will be more easily achieved.

Pingback: Oh, The Games That Are Played! – Ryan ALM Blog
Pingback: P&I: Asset Owner CIOs See Uncertainty in 2025 – Ryan ALM Blog